Thursday, June 13, 2024

Evaluation of Cell Lysis Due to Ice Crystals in Cell Freezing


Evaluation of Cell Lysis Due to Ice Crystals in Cell Freezing

Introduction

Cell freezing is widely used in regenerative medicine and cryosurgery, and it is important to prevent cell damage during cell freezing. Studies have indicated that in addition to osmotic stress, cell damage at low cooling rates is due to cell compression caused by the development of ice crystals that form outside the cells [2- 6]. Cells appear to be compressed in the narrow spaces between the many needle-shaped ice crystals that develop [7,8]. Therefore, the damage mechanism is thought to be the mechanical stress of compressive deformation causing cells to break down, leading to lysis. This compression can be modeled as the compression of two parallel plates on a single cell. Takamatsu, et al. [1,9] performed compression experiments by placing a cell between two parallel plates and investigated the relationship between the reduction rate of the gap between the plates and the cell viability. There have been extensive studies for deriving the mechanical properties of cells from their responses when subjected to mechanical stress [10-14]. The measurement of the mechanical properties of cells allows the mechanical modeling of the deformation of the cell membrane and cytoskeleton, and the relationships between the changes in mechanical properties and the lesion state of the cell can be investigated. In experiments where cells were compressed by parallel plates, the relationship between the force and displacement or between the stress and strain has been determined using microcantilevers [15-18].

In the present study, the compressive deformation of cells was analyzed using a method wherein microcapsules were compressively deformed by parallel plates [19]. The target cells were human prostatic adenocarcinoma cells, which had previously been subjected to plate compression experiments and their viability was measured [1]. We performed calculations corresponding to this experiment to determine the cell strain, the tension generated in the membrane, and the pressure difference between the inside and outside of the cell for the compressive force. When cells are compressed, the membrane undergoes expansion strain and shear strain, but it is shown that the expansion tension is related to cell lysis, and a relationship between the maximum value of the expansion tension and the cell viability is determined. During cell freezing, the osmotic pressure of the surrounding solution changes, along with the cell size. The surface area increases when the cells are compressed, and the relationship between the rate of increase of the surface area and the cell lysis is investigated. We show that the evaluation indices for the cell viability that are independent of the cell size are the rate of increase of the surface area and the deformation shape of the cell.

Analysis

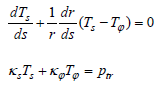
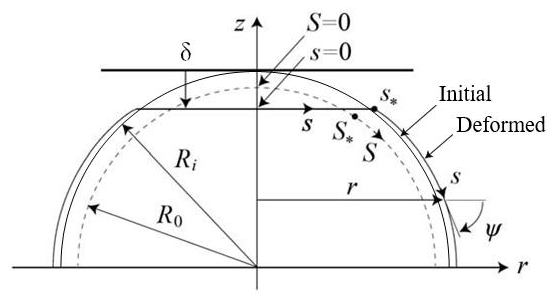
A computational model of a spherical cell compressed by two parallel plates is shown in Figure 1. The deformation is assumed to be axisymmetric, and only the upper half is treated assuming the vertical symmetry of the shape. The initial radius of the cell is denoted as Ri, and the displacement of the upper half when it is compressed by the plate is denoted as δ. The cytoskeleton consists of actin filaments, microtubules, and intermediate filaments. The actin filaments, which exist along the inner side of the cell membrane, mainly support the mechanical structure of the surface [20]. Therefore, we modeled the cell surface as an elastic membrane. In addition, the actin filaments, microtubules, and intermediate filaments inside the cell support the structure of the whole cell [17]. Therefore, we represent the actions of these components as the maintenance of the original volume of the whole cell. Cells adhere to the plates during plate compression, and in general, membrane tension is generated when cells adhere to a plate [21,22]. This tension is treated as the initial tension and modeled as follows. When there is no tension in the cell membrane, the cell is a sphere of radius R0, and the initial tension Ti is generated when the sphere expands to radius Ri. At this time, the initial stretch of the membrane is λi = Ri / R0 . The axis along the meridian of the sphere of radius R0 is denoted as S, and that along the meridian of the shape after deformation due to plate compression is denoted as s. The angle between axis s and axis r is denoted as ψ . For an axisymmetric elastic membrane, the equations of the static force balance in the tangential and normal directions in the meridian plane are given as follows [10], in which the bending stiffness of the membrane is ignored.
biomedres-openaccess-journal-bjstr

Figure 1: Analysis model.

Here, Ts and Tφ represent the principal tensions in the meridian plane and the principal tension in the circumferential direction, respectively. κ s and κϕ represent the principal curvature in the meridian plane and the principal curvature in the orthogonal plane, respectively. ptr represents the transmural pressure, i.e., the pressure difference between the inside and outside (internal pressure – external pressure). The principal stretch in the meridian plane λs and the circumferential principal stretch λφ are given by , where R represents the r coordinate in the initial state of the material point after deformation. The tensions Ts and Tφ are calculated using Evans and Skalak’s model [10] for biological membranes;


 , and Tφ is obtained by interchanging λs and λφ in Ts.

K(= Eh / 2(1− v)) represents the area-expansion modulus, and μ (= Eh / 2(1+ v)) represents the shear modulus. Here, E represents the Young’s modulus, h the membrane thickness, and ν the Poisson’s ratio. The isotropic tensions, i.e., the expansion tension Te, the shear tension Tsh, and the Mises tension TM, which is used to predict material failure according to the yield condition of the material, are determined using the following equations.

The Young’s modulus E and Poisson’s ratio ν are for membranes, but when determining the elastic modulus of a cell using atomic force microscopy, the Young’s modulus E’ of the entire cell is often determined using the relationship between the force and displacement for the entire cell. Therefore, the approximate relationship ' i Eh = E R for ν = 0.5 was used to obtain the Eh from E’ and Ri. The above equations were solved under the condition that the volume inside the cell does not change and the symmetry conditions of the shape at z = 0 (i.e.ψ = π /2) to determine the strain of the cell, deformation shape, tension distribution, and pressure difference for the compressive force. The calculation method was described in detail in [19].

Results and Discussion

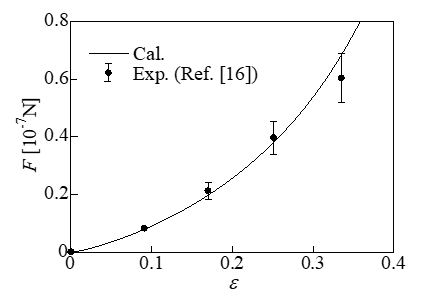
To validate the computational model, a comparison with experimental results (16) was performed. In this experiment, a single endothelial cell was subjected to a compression test using parallel plates, and the relationship between the force F and the compressive strain ε (= δ / Ri) was determined, as shown in Figure 2. In the calculation, the cell diameter was assumed to be 17.4μm, according to the experimental images. The Young’s modulus E’ of the whole cell was set as 1220Pa according to the Young’s modulus of the cytoplasm (1000Pa), the Young’s modulus of the nucleus (2500Pa), and the estimated volume ratio of the nucleus to the cytoplasm (0.17). Fitting to the experimental results was performed with the initial stretch set as λi = 1.12. The calculation results are indicated by the solid line in Figure 2. They agreed well with the experimental results with reasonable errors. According to the calculation, the initial tension determined from the initial stretch of the membrane was 2.7mN/m. According to measurements of HeLa cells (15-25μm in diameter) attached to a substrate, the membrane tension ranged from 2.73 to 3.62mN/m [22]. The results of the present calculations are close to these values.
biomedres-openaccess-journal-bjstr

Figure 2: Relationship between the force and compressive strain.

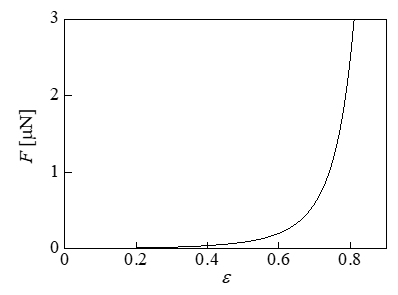
When cells are frozen at a low temperature drop rate, ice crystals develop in a needle-like shape on the outside of the cells over time, and the cells appear to be compressed in the narrow spaces between the crystals [7,8]. Therefore, Takamatsu, et al. [1] hypothesized that the mechanical stress of compression is a major cause of cell damage during cell freezing, and as a model experiment, they performed compression tests on cells using parallel plates and investigated the relationship between the compression rate and the cell viability. The target cells were human prostatic adenocarcinoma cells. In the experiment, the change in the cell size caused by the change in the external osmotic pressure generated during cell freezing was considered; i.e., compression testing was performed on these cells by changing the concentration of an extracellular NaCl aqueous solution, which changed the cell diameter to 15.4, 17.8, and 20.5μm. Table 1 presents the relationship between the compressive strain ε and the cell viability, which were averaged for the three kind of cells. The data were taken from Figure 6 in Ref. [1]. For the cell with diameter d (= 2Ri) = 17.8μm, calculations were performed for compression due to parallel plates. The Young’s modulus of the membrane E of prostate cancer was calculated using the measured Young’s modulus of a whole cell, i.e., E’ = 452Pa [23]. The initial stretch was set as λi = 1.12, which was used in the calculation shown in Figure 2. The calculation results for the relationship between the compressive force F and the strain ε are presented in Figure 3. When the strain was larger than ε = 0.7, the force F increased rapidly; thus, the viability decreased significantly, as shown in Table 1.

biomedres-openaccess-journal-bjstr

Table 1: Relationship between the compressive strain and the cell viability [1].
biomedres-openaccess-journal-bjstr

Figure 3: Relationship between the compressive force and the strain (d = 17.8μm).

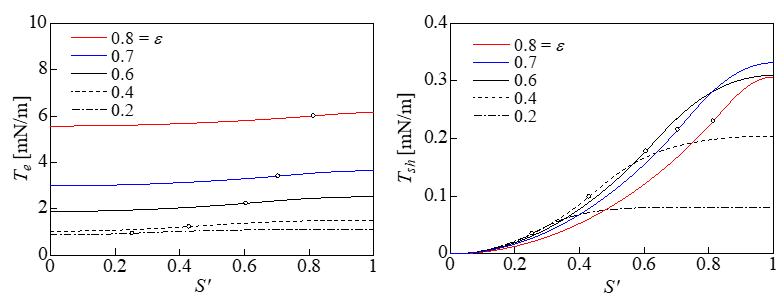
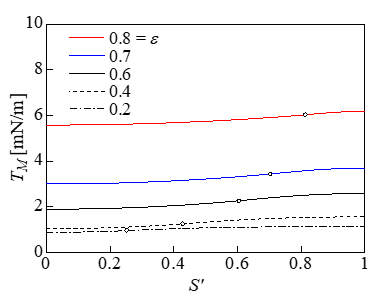
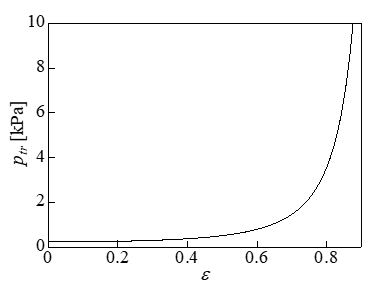
Figure 4 shows the variations in the expansion tension Te and shear tension Tsh with respect to the dimensionless S ' (= 2S /π R0 ) when the strain ε was varied. The white circles in the figure indicate the points corresponding to S*. The contact area with the plate is shown on the left of the white circles, and the non-contact area with the plate is shown on the right. Te was approximately uniform on the membrane and was maximized at S’ = 1 ; i.e., at z = 0. In addition, Te increased with the strain ε. The shear tension Tsh increased with S’ and was maximized at z = 0. However, Tsh was approximately one order of magnitude lower than Te. Figure 5 shows that the distribution of the Mises tension TM was almost identical to Te in Figure 4, indicating that the expansion tension caused cell lysis. Figure 6 shows the relationship between the strain and the pressure difference. When a cell lyses, the pressure difference is thought to decrease to zero from the pressure difference immediately before the lysis. The volume loss during compression is derived from dV = ALp ptrdt , where Lp is the water permeability of the cell membrane. The value for the erythrocyte membrane Lp = 0.92 × 10- 12m/sPa [24] was used as Lp, the surface area of a spherical cell of diameter 17.8μm was used as the surface area A, and dt represents the time (10min) that the cell was under compression [1]. The rates of volume loss were 19% and 37% at ptr = 1 and 2 kPa, respectively. In this cell model, the cytoskeleton inside the cell works to keep the volume of the whole cell constant, and the water permeability of the membrane is ignored.
biomedres-openaccess-journal-bjstr

Figure 4: Variations in Te and Tsh (d = 17.8μm).
biomedres-openaccess-journal-bjstr

Figure 5: Variations in TM (d = 17.8μm).
biomedres-openaccess-journal-bjstr

Figure 6: Relationship between the pressure difference and the strain (d = 17.8μm).

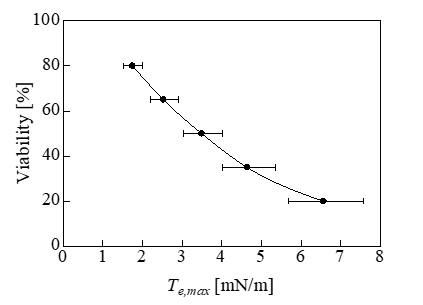
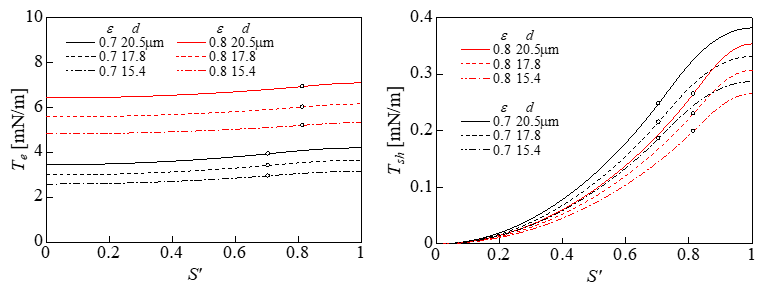
To investigate the effect of the change in the cell diameter on the tension, we performed calculations for cells with diameters of 15.4, 17.8, and 20.5μm with ε = 0.7 and 0.8. The calculation results for Te and Tsh are shown in Figure 7. Te and Tsh both increased with the diameter. Therefore, it was expected that a larger diameter would correspond to lower cell viability, similar to the results of a previous experiment [1]. Figure 8 shows the relationship between the maximum value of Te, i.e., Te,max, and the viability of cells with a diameter of 17.8μm. The error bars in Figure 8 indicate the changes in Te,max when the diameter changed from 15.4 to 20.5μm. The causal factor triggering the cell lysis was thought to be the Te,max in Figure 8. The positions of Te,max are indicated by the black dots in Figure 11. The cytoskeletal structure of erythrocytes is mainly composed of spectrin on the inner side of the cell membrane, which differs from the cytoskeletal structure of prostatic adenocarcinoma cells. The expansion tension at which erythrocytes undergo hemolysis is Th = 15mN/m [25], which exceeds the maximum value (Te,max) in Figure 8. The radius of the erythrocyte when it was expanded to a sphere without changing the surface area from its initial value of 138μm2 [26] was assumed to be rh. The pressure difference ptr at this time was ptr = 9.1 kPa calculated by the Laplace equation ptr = 2Th / rh . This was the pressure difference that causes hemolysis of erythrocytes. By comparing this value with the results shown in Figure 6, the compressive strain was determined to be 0. 87.
biomedres-openaccess-journal-bjstr

Figure 7: Changes in Te and Tsh.

biomedres-openaccess-journal-bjstr

Figure 8: Relationship between the maximum expansion tension and the cell viability.

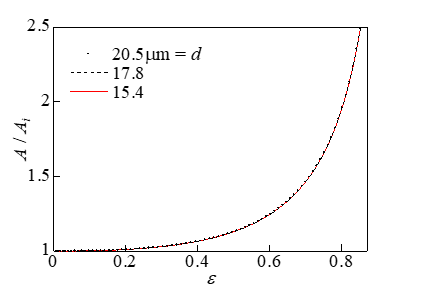
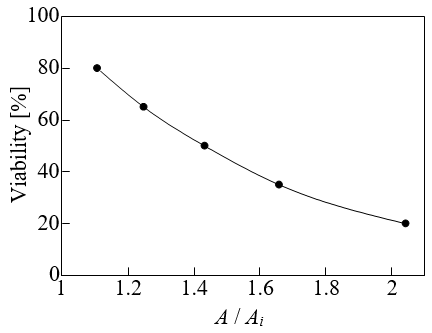
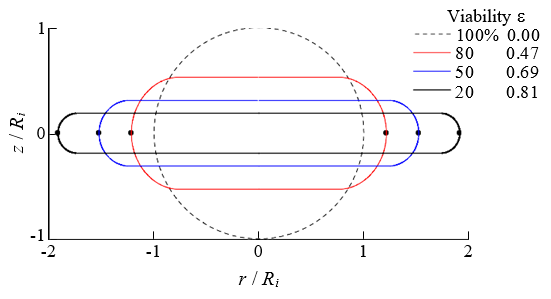
The surface area increases when cells are compressed. The results of the effect of the change in the cell diameter on the rate of increase of the surface area A/Ai during compression are presented in Figure 9. Here, Ai (=π d 2 / 2) represents the surface area in the initial state. As shown in Figure 9, the effect of the change in the cell diameter on A/Ai was negligible. Therefore, the rate of increase of the surface area was independent of the cell size and was used as an evaluation index for the cell viability. Figure 10 shows the relationship between A/Ai and the viability. The results shown in Figures 9 & 10 are almost the same as those in Ref. [1]. Figure 11 shows the deformed shape of the cell resulting from compression. Here, ε = 0, 0.47, 0.69 and 0.81 correspond to the initial state and the compression states at 80%, 50%, and 20% viability, respectively. Because the deformation shape was independent of the cell diameter, a dimensionless representation with the initial radius Ri as the representative length is presented in Figure 11. Thus, the deformation shape was independent of the cell size and was used as an evaluation index for the cell viability. The black circle indicates the position where the expansion tension reached its maximum value Te,max.
biomedres-openaccess-journal-bjstr

Figure 9: Relationship between the strain and the rate of increase of the surface area.
biomedres-openaccess-journal-bjstr

Figure 10: Relationship between the rate of increase of the surface area and the cell viability.
biomedres-openaccess-journal-bjstr

Figure 11: Relationship between the dimensionless deformation shape resulting from compression and the cell viability.

Conclusion

We performed calculations to model the process of cells being compressed by the development of external ice crystals in cell freezing under a slow temperature drop and obtained the following results.

1) The cause of cell lysis was expansion tension in the membrane of cortical actin filaments, and the effect of shear tension was negligible.

2) When the cell size increased owing to external osmotic pressure, the expansion tension due to the compression increased. Therefore, larger cells had lower viability under compression.

3) For prostatic adenocarcinoma cells with a diameter of 17.8μm, the expansion tensions that resulted in 50% and 20% viability were 3.5 and 6.6mN/m, respectively, and the rates of increase in the surface area were 1.4 and 2.0, respectively. 4) The rate of increase of the surface area under compression and the deformation shape are indices of the cell viability, because they are independent of the cell size in the range from d =15.4 to 20.5μm.


For more Articles on: https://biomedres01.blogspot.com/

Wednesday, June 12, 2024

A New Quantitative Method for Detecting SNP Heterozygous Samples by Sanger First Generation DNA Sequencing


A New Quantitative Method for Detecting SNP Heterozygous Samples by Sanger First Generation DNA Sequencing

Introduction

Sanger DNA sequencing is the widely used “gold standard method” to verify the results of TaqMan qPCR and second generation DNA sequencing [1-5]. At the same time, with the technological and commercial advances, many outsourcing companies provide Sanger DNA sequencing services [6,7]: as long as the customer provide the sequencing materials and information, such as DNA template, amplification primers, sequencing primers, and sequencing requirements for the target DNA, the outsourcing companies can professionally perform the steps including the amplification of target DNA template fragments with ordinary PCR, electrophoresis, recovery of amplified DNA template fragments, mixing DNA templates, sequencing primers and sequencing dye mixture Big Dye, sequencing the DNA template on Sanger sequencer, and finally the DNA sequencing map is produced, which can be opened and analyzed by the open software Chromas.

SNP is the abbreviation of single nucleotide polymorphism. SNP exists widely in human genome [8,9]. For a specific SNP site, human beings have two sequence sources, one from father and the other from mother [10-12]. Therefore, for human SNP sites, there are homozygous and heterozygous genotypes: homozygous genotype refers to same SNP signals from father and mother, and heterozygous genotype refers to different SNP signals from father and mother. For the case of heterozygosity, the two SNP signals are usually equal in quantity, and the ratio is 1:1. The detection of heterozygous SNP samples is generally based on TaqMan PCR and second-generation DNA sequencing to find putative sites, and then further verified by Sanger DNA sequencing. Because the heterozygous SNP samples have different SNP signals of 1:1, there will be two overlapping signal peaks at the SNP sequencing map, so it can be judged that this person is heterozygous genotype for that SNP site. However, due to the process of DNA extraction or the existence of genomic chimerism in heterozygous SNP samples, the amount of two kinds of SNP signals is sometimes not 1:1, and there may be a variety of ratios such as 2:1, 5:1, 10:1, 20:1, etc. The sequencing maps for heterozygous SNP samples with those unconventional ratios have not been systematically studied, which will cause misjudgment or missed judgment.

In this study, we artificially simulated SNP heterozygous samples with nucleotides polymorphisms, mixed two of the DNA templates with different SNP in the ratio of 1:1, 2:1, 5:1, 10:1 and 20:1, and then analyzed the SNP sequencing map for the samples with different ratios, in order to establish the overlapping model map of nucleotide signals at different ratios, providing reference for correctly judging the SNP heterozygosity for different nucleotides.

Materials and Methods

DNA Templates and Primers for PCR and Sequencing DNA Templates:

(1) Template 1: P-ctDNA-1, the sequence is as follows, and the SNP site was heavily marked red: 5’-AGCAGAGGGGACATGAAATAGTTGTCCTAGCACCTGACGCCTCGT TGTACATCAGAGACAGAGCATTTT ACACCTTGAAGACGTACCCTG-3’;

(2) Template 2: P-ctDNA-2, the sequence is as follows, and the SNP site was heavily marked red: 5’-AGCAGAGGGGACATGAAATAGTTGTCCTAGCACCTGACGCCTCGTTGTACATCAGAGACGGAGCATTTT ACACCTTGAAGACGTACCCTG-3’;

(3) Template 3: P-ctDNA-C, the sequence is as follows, and the SNP site was heavily marked red: 5’-AGCAGAGGGGACATGAAATAGTTGTCCTAGCACCTGACGCCTCGT TGTACATCAGAGACCGAGCATTTT ACACCTTGAAGACGTACCCTG-3’;

(4) Template 4: P-ctDNA-T, the sequence is as follows, and the SNP site was heavily marked red: 5’-AGCAGAGGGGACATGAAATAGTTGTCCTAGCACCTGACGCCTCGT TGTACATCAGAGACTGAGCATTTT ACACCTTGAAGACGTACCCTG-3’;

(5) Preparation of SNP heterozygous sample templates: artificially mixed any two of P-ctDNA-1, P-ctDNA-2, P-ctDNA-C and P-ctDNA-T samples with the ratio of 1:1, 2:1, 5:1, 10:1 and 20:1, and the final concentration was 12 μM. PCR amplification primers: (1) Primer 1: forward primer, P-ctDNA-3: 5’-AGCAGAGGGGACATGAAATA- 3’;

(2) Primer 2: backward primer, P-ctDNA-4: 5’-CAGGGTACGTCTTCAAGGTG-3. Sequencing primer: P-ctDNA-3: 5’-AGCAGAGGGGACATGAAATA-3’.

Sequencing Outsourcing Services

Chengdu Branch of Nanjing Qingke Biotechnology Co., Ltd. (Qingke company) was selected as the sequencing service provider. All SNP heterozygous sample templates with different ratios, amplification primers and the sequencing primer, and sequencing requirements were provided to Qingke company. The target band size for sequencing was 90 base pairs. The sequencing operations were professionally carried out by Qingke company. Finally, we obtained the DNA sequencing maps, which were map files with suffix ab1.

Analysis of Sequencing Map

The software for sequencing map analyses was chromas 2.6.5, which is a freeware. The analysis method was as follows: using Chromas software to open the map file with suffix ab1, produce the map picture, focus on the picture details at the target SNP site, and eventually obtain the picture mode for the SNP heterozygosity.

Results

A: G = 1:1 in SNP Heterozygous Template

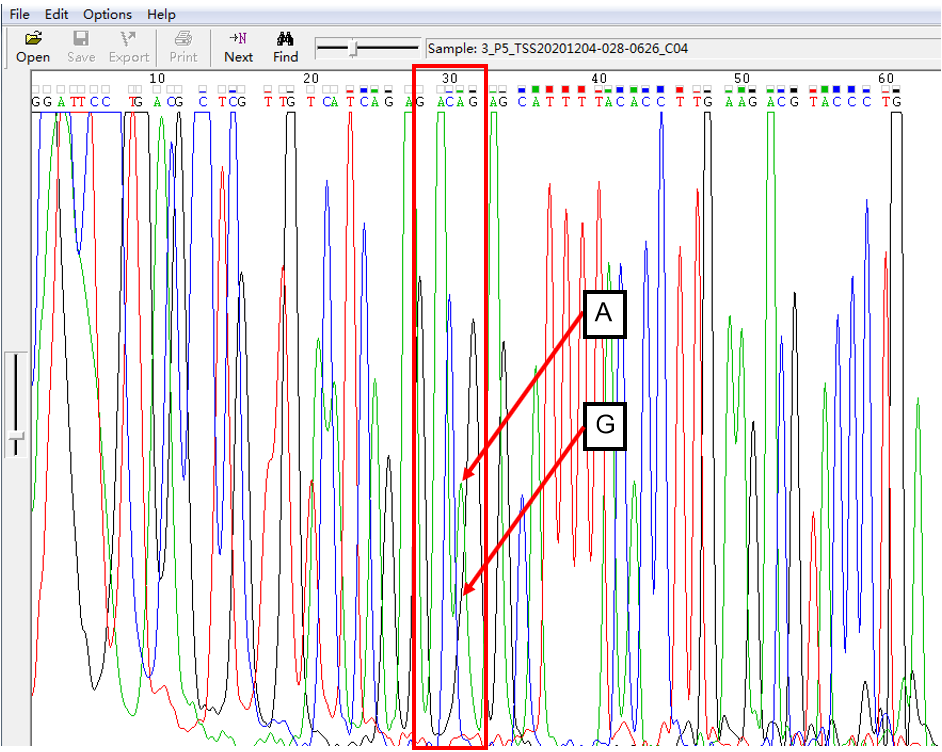
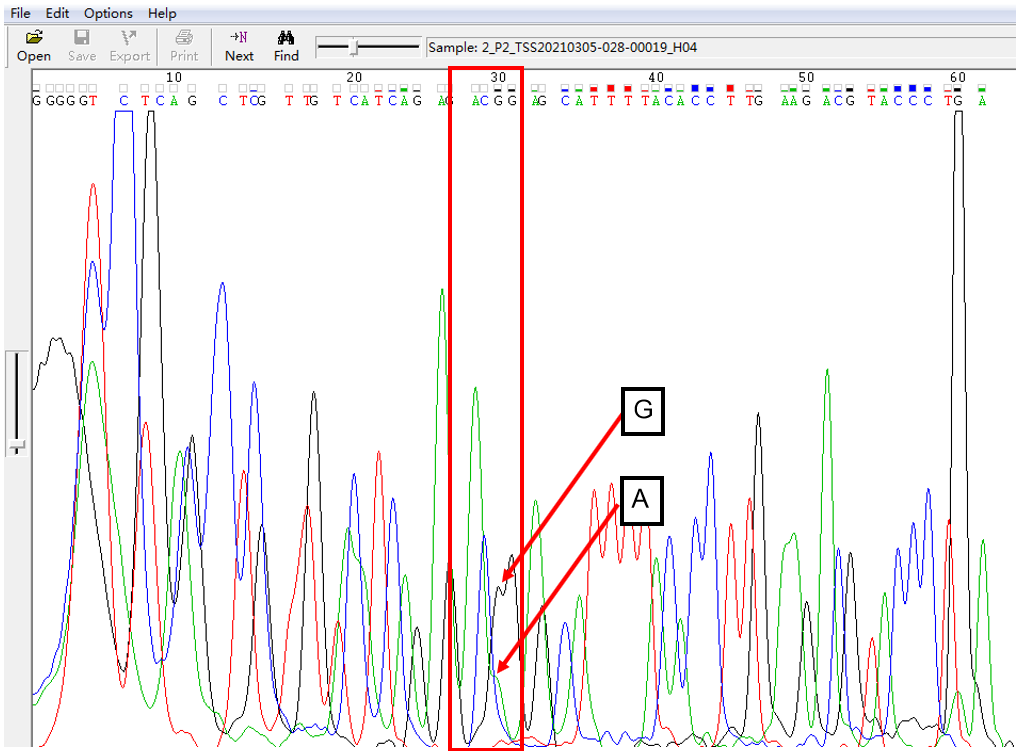
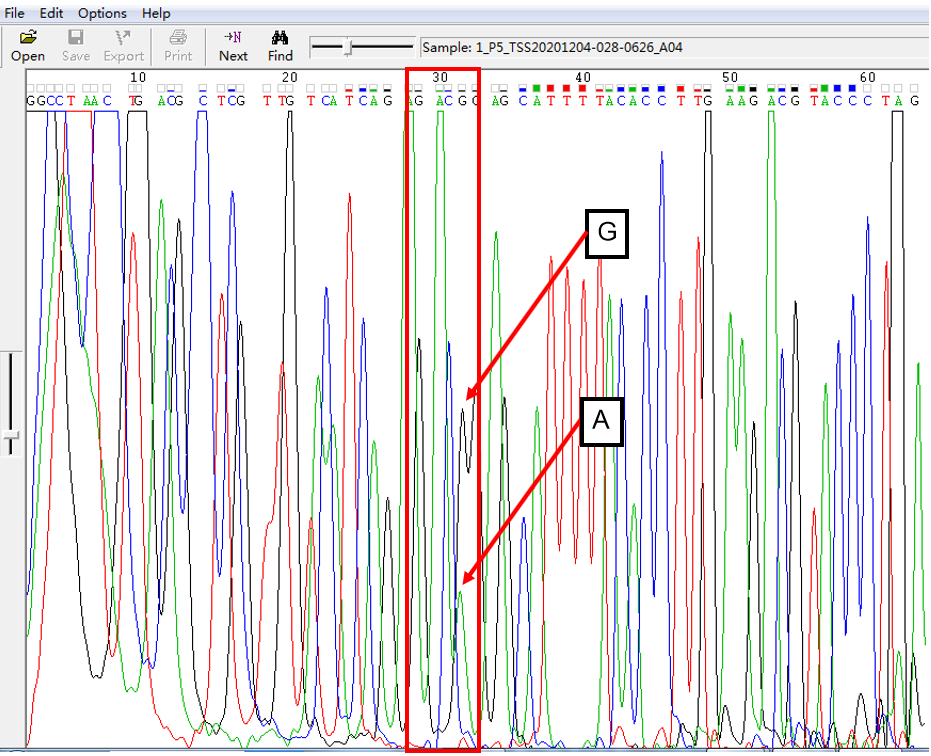
As shown in Figure 1, the signal of G overlapped with that of A, and the signal intensity of G was higher than that of A. This was the case of A: G = 1:1. The signal intensity is not only related to the amount of template, but also related to the fluorescent dye linked with different nucleotides.

A: G = 2:1 in SNP Heterozygous Template

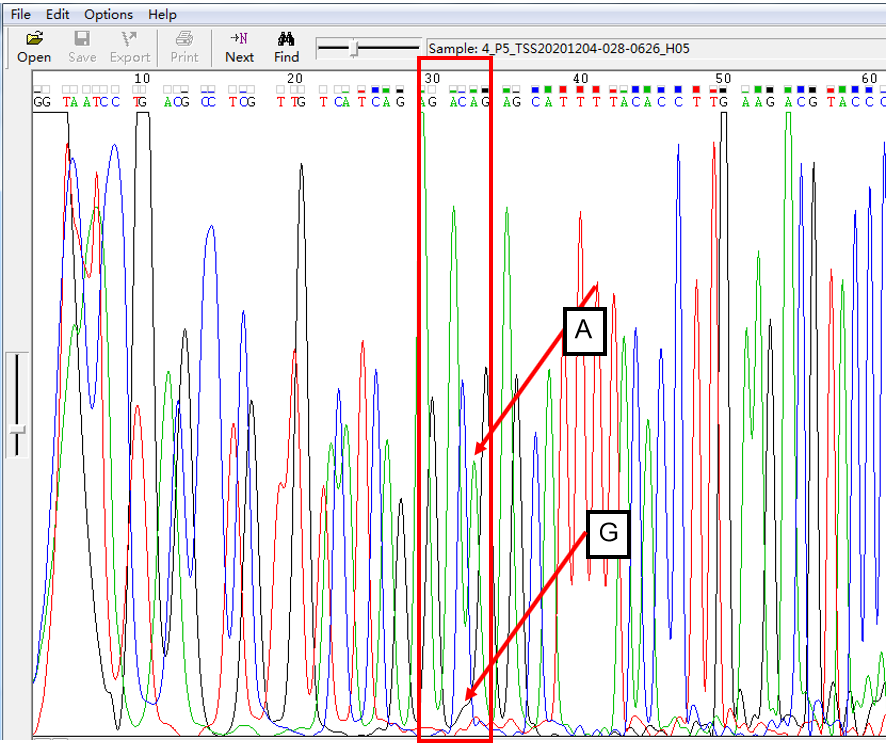
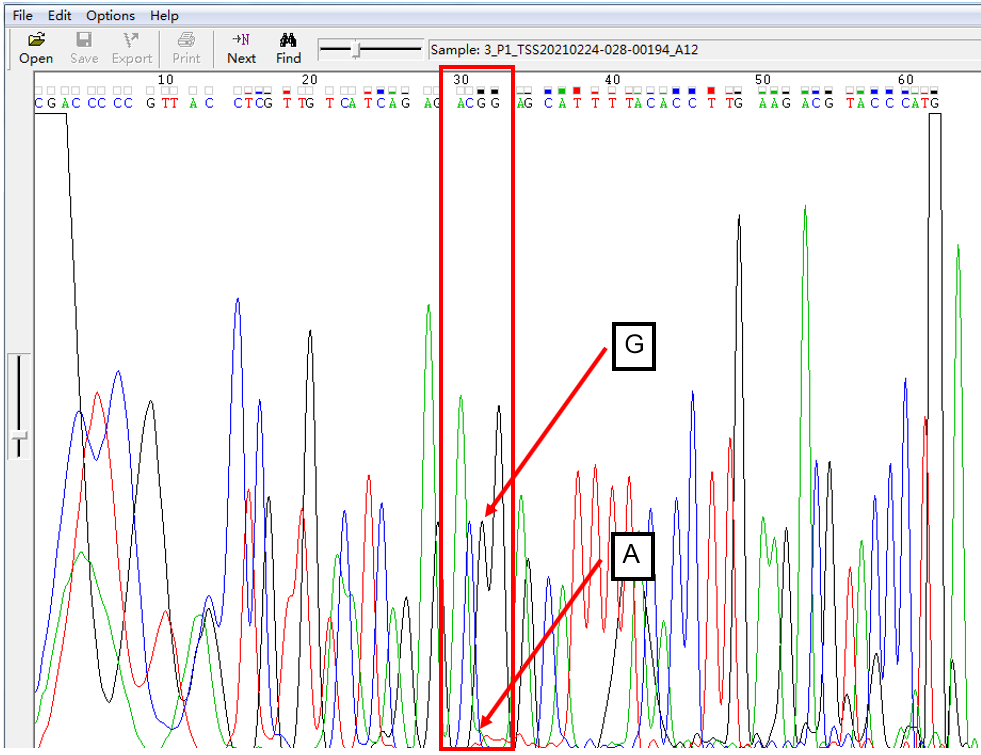
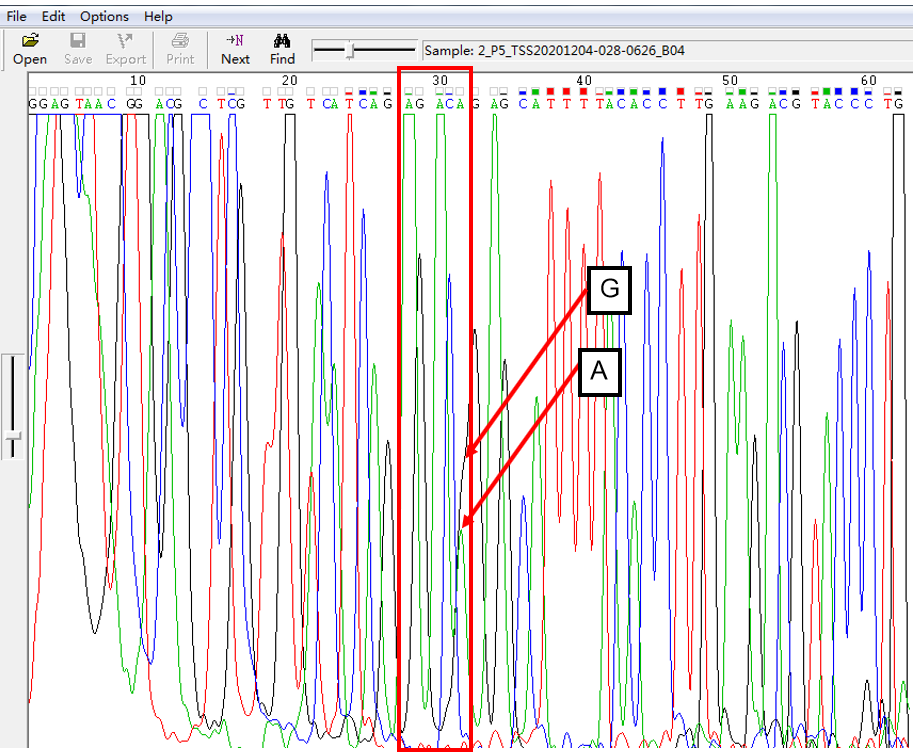
As shown in Figure 2, the signal of G overlapped with that of A, and the signal of G invaded the signal area of A in the form of a “big shoulder”. The signal intensity of G was higher than that of A, which was the case of A: G = 2:1.

A: G = 5:1 in SNP Heterozygous Template

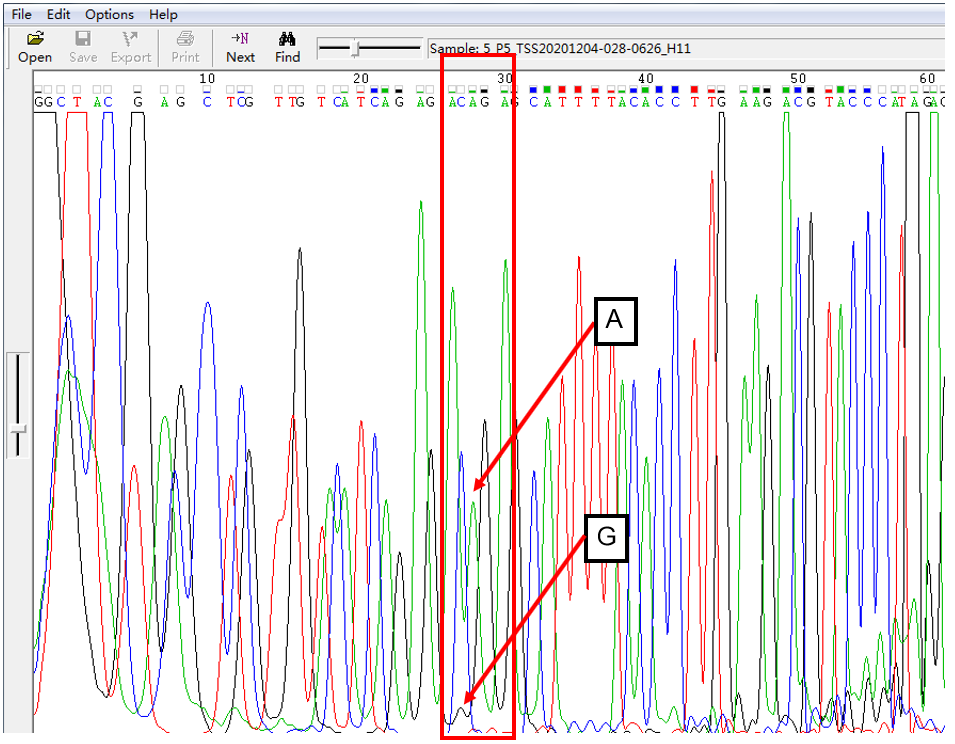
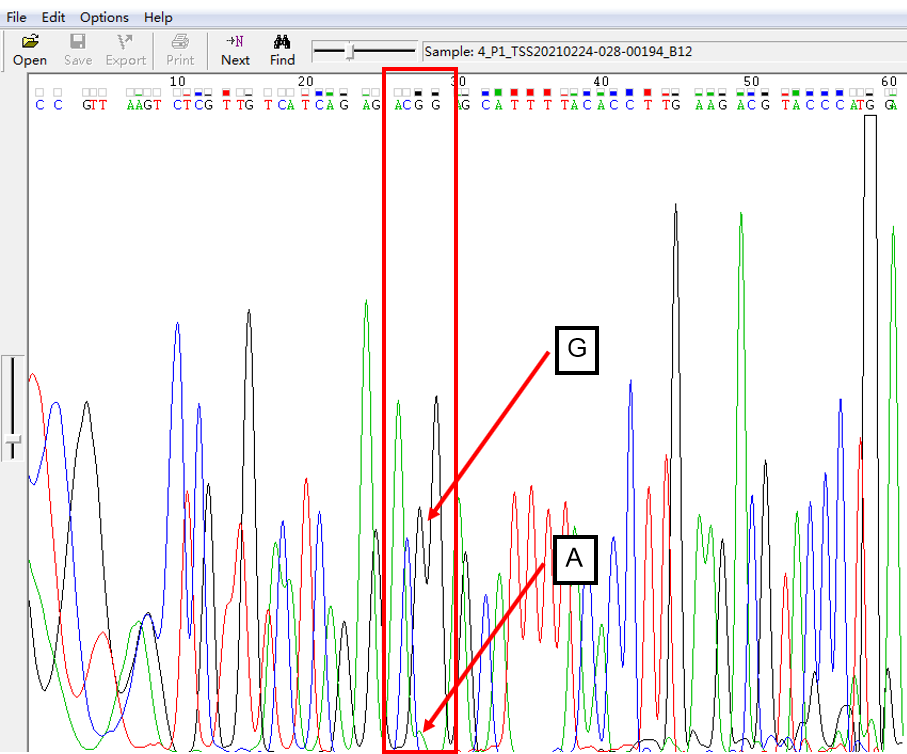
As shown in Figure 3, the signal of G overlapped with that of A, and the signal of G invaded into the signal area of A in the form of a “medium shoulder”. The signal intensity of G was lower than that of A, which was the case of A: G = 5:1.

biomedres-openaccess-journal-bjstr

Figure 1: The sequencing map of SNP heterozygous template when A: G = 1:1.

biomedres-openaccess-journal-bjstr

Figure 2: The sequencing map of SNP heterozygous template when A: G = 2:1.

biomedres-openaccess-journal-bjstr

Figure 3: The sequencing map of SNP heterozygous template when A: G = 5:1.

A: G = 10:1 in SNP Heterozygous Template

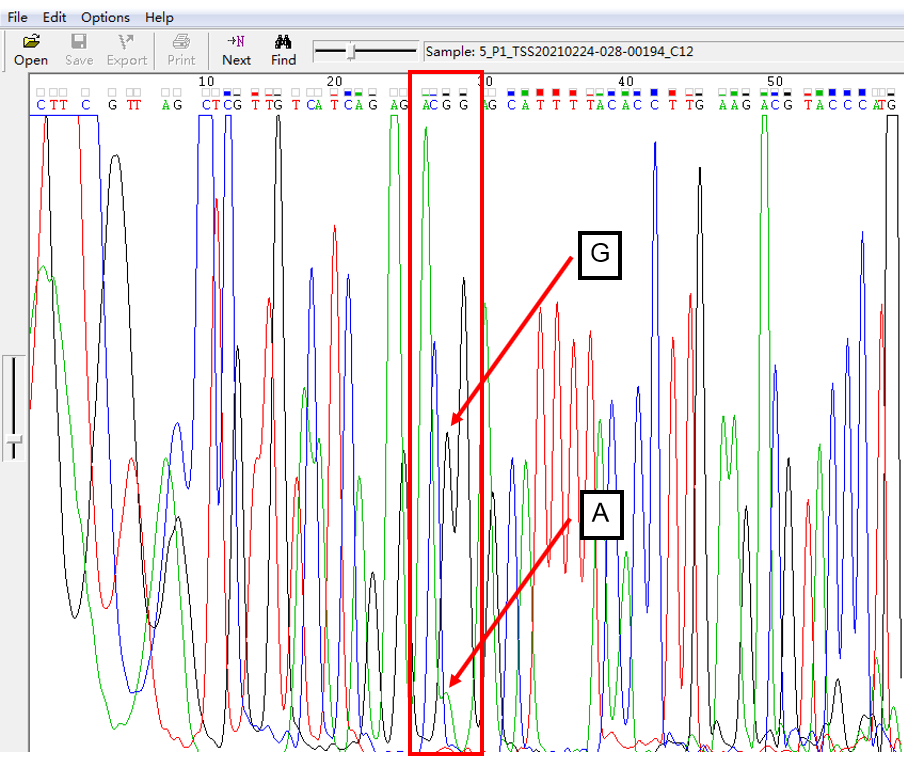
As shown in Figure 4, the signal of G overlapped with that of A, and the signal of G invaded into the signal region of A in the form of a “small shoulder”. The signal intensity of G was lower than that of A, which was the case of A: G = 10:1.

A: G = 20:1 in SNP Heterozygous Template

As shown in Figure 5, the signal of G overlapped with that of A, and the signal of G invaded into the signal region of A in the form of a “small shoulder”. The signal intensity of G was lower than that of A, which was the case of A: G = 20:1.

G: A = 2:1 in SNP Heterozygous Template

As shown in Figure 6, the signal of G overlapped with that of A, and the signal of A invaded the signal area of G in the form of a “big shoulder”. The signal intensity of G was higher than that of A, which was the case of G: A = 2:1.

G: A = 5:1 in SNP Heterozygous Template

As shown in Figure 7, the signal of G overlapped with that of A, and the signal of A invaded the signal area of G in the form of a “small shoulder”. The signal intensity of G was much higher than that of A, which was the case of G: A = 5:1.

G: A = 10:1 in SNP Heterozygous Template

As shown in Figure 8, the signal of G overlapped with that of A, and the signal of A invaded the signal area of G in the form of a “small shoulder”. The signal intensity of G was much higher than that of A, which was the case of G: A = 10:1.

G: A = 20:1 in SNP Heterozygous Template

As shown in Figure 9, the signal of G overlapped with that of A, and the signal of A invaded the signal area of G in the form of a “small shoulder”. The signal intensity of G was much higher than that of A, which was the case of G: A = 20:1.

biomedres-openaccess-journal-bjstr

Figure 4: The sequencing map of SNP heterozygous template when A: G = 10:1.

biomedres-openaccess-journal-bjstr

Figure 5: The sequencing map of SNP heterozygous template when A: G = 20:1.

biomedres-openaccess-journal-bjstr

Figure 6: The sequencing map of SNP heterozygous template when G: A = 2:1.

biomedres-openaccess-journal-bjstr

Figure 7: The sequencing map of SNP heterozygous template when G: A = 5:1.

biomedres-openaccess-journal-bjstr

Figure 8: The sequencing map of SNP heterozygous template when G: A = 10:1.

biomedres-openaccess-journal-bjstr

Figure 9: The sequencing map of SNP heterozygous template when G: A = 20:1.

Other SNP Heterozygous Templates

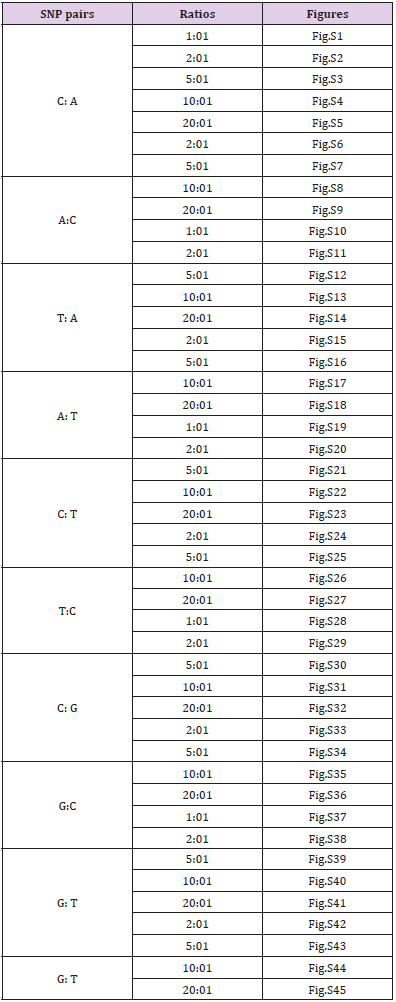
There were other pairs for SNP heterozygous templates summarized in the following Table 1 and supplementary materials.

biomedres-openaccess-journal-bjstr

Table 1: The summary of other pairs for SNP heterozygous templates.

Note: *p < 0.05 against CC, ^p < 0.05 against Post-HB, #p < 0.05 against Pre-HB.

Discussion

Through the analyses of SNP heterozygous samples with different proportions of samples, we could know the patterns of SNP heterozygous signals of different bases with various specific proportions, which could provide a judgment mode for using Sanger first generation DNA sequencing to verify SNP heterozygosity, which has not been systematically reported by all parties, so this study had the novelty. In conclusion, a new semi quantitative method for detecting SNP heterozygous samples solely by Sanger first generation DNA sequencing technology was established. This method can be used to guide the analysis of SNP heterozygous samples and is also suitable for the situation of limited data and the need for rapid SNP judgment in emergency.


For more Articles on: https://biomedres01.blogspot.com/
Tuesday, June 11, 2024

Gastrointestinal Tract Parasites of Camel in and Around Dire Dawa


Gastrointestinal Tract Parasites of Camel in and Around Dire Dawa

Introduction

Camel (Camelus dromedarius) an important livestock uniquely adapted to arid and semi-arid environments [1] Camels in addition to serving as beast of burden and draft power produce milk, meat and wool, hair and hides [1]. Camel has a lot to do in pastoral social life in that it is the first among domestic animals to be considered as a social prestige in the world [2]. The dromedary has an estimated population of 18.5 million in the world [3]). In Africa, the dromedary camel population is about 15 million, which accounts 74% of the world’s camel population. Of these, 60% are found in Eastern parts of Africa i.e Somalia (6.2 million), Sudan (2.8 million), Kenya (0.9 million) and Ethiopia (1.7 million) [1,3]. The habitat on which camel lives generally is not suitable to development and transmission of parasites [4]. In spite of this, it harbors surprisingly diverse fauna of helminthes [5] and all classes of metazoan parasites were reported. Various groups of nematodes, trematodes, cestodes parasites of camel have been reported [5] and the major species include Moneizia, Strongyles, Haemonchus, Trichostrongyles, Fasciola, Tricuris and coccidian.

There has been little research done on disease of camel in Ethiopia. General field observations and a few surveys have indicated that camel diseases including parasitic diseases, low production low lifetime performance of female breeders and high calf mortality were the major constraints encountered in camels on Ethiopia [1]. There is some information on camel helminthes in Ethiopia. Some of these unpublished works on helminthes disease of camel in country include [2,5-11]. However, still there is a considerable gap in our knowledge of prevalence rate, the species of parasite involved, potential risk factors and economic impacts of gastrointestinal helminthes in camel population of Ethiopia in general and Dire Dawa area in particular.
Therefore, the objectives of this study were:
1. To estimate the prevalence rate of GIT helminthes in and around Dire Dawa.
2. To identify the species of GIT helminthes of camel in the study area.
3. To assess the potential risk factors of GIT parasites in camel of the study area.

Materials and Methods

Study Area

The study was undertaken in and around Dire Dawa administrative council in Eastern part of Ethiopia. Dire Dawa is located at 518km east of Addis Ababa at 9036’N and 40 52’E. The area has an altitude ranging between 226m and 950m.a.s.l. [12]. It has harsh climate with low unreliable and unevenly distributed rainfall with regular high temperature. The rainfall has bi-modal patterns with highest rainfall in July and August. The average annual rainfall varies700mm-900mm. the monthly mean maximum temperature ranges from 28.1oc I December and January and 34.6oc in May [12].

The administrative council is bordered to the South, South-east and South-west with Eastern Harrarghe zone of Oromiya Regional State and to the East, North-east, and North-west with Shinille zone of Somali Regional State. The total area of the administrative council is about 1,288.02 km2 [12]. Generally, livestock population of the study area recorded in [12]. exceeds 247,502of these goats make the highest proportion (51.26%) followed by cattle (22.09%); sheep (20.66%) and camel (2.24%).

Study Animal

A total of 200 camels were examined in and around Dire Dawa for GIT helminthes. This figure comprises randomly selected 123 adults and 77 young of which 100 were males and 100 were females. Sex selection was purposively done. The major area from where the samples came include Shinille, Melka-jebdu, Wursso, Issa village and Dire Dawa.

The Study Design and Methodology

The study was the cross-sectional survey in which the prevalence of the GIT helminthes had been estimated on the basis of routine fecal examination of individual samples. The fecal samples were collected from 200 camels directly from the rectum by using rectal gloves and place in universal bottle prepared with formalin solution until examined in the laboratory. Postmortem examination had been carried in the Dire Dawa municipal abattoir from 50 adult camels in addition to their fecal examination. During the survey, individual camel’s address, age and sex were recorded. Dental eruption and wear were used to consider age categorization [13]. Baesd on this bellow four years old considered as young and above four years as adult.

Laboratory Works

Coproscopic Examinations: A fecal sample of 10 to 15g was collected directly from rectum by using rectal glove and samples were placed in universal bottle half fill with formalin solution and tightly sealed. The samples were labeled and immediately dispatched to Dire Dawa regional veterinary diagnostic and investigational parasitological section laboratory. On some occasions samples were stored in +4oc frig for about 72 hours when immediate examination was not possible on the basis of wilson,[13] The laboratory technique employed were mainly qualitative fecal analysis i.e floatation, sedimentation, and Barman’s technique were practiced. Positive samples for helminthes egg examination were cultured at incubator temperature 37oc for aweek and then larvae identified by using Burmen’s technique [14]. Fecal culture was done by taking 19g of feces in a tray and then moistening with water if too dry or adding charcoal if too wet and incubating for a week.

Postmortem Examination: The survey was supported by postmortem examination on GIT helminthes of 50 camels (adult camels that were slaughtered at Dire Dawa municipal abattoir. Any parasite that was found in ruminal compartments of camel’s GIT examined grossly and microscopically from ruminal contents and identification was based on [13-15]. In addition, their location (sites within the lumen) and morphologies were used as reference frame in identification of adult parasites in their genus level.

Data Analysis: Data were entered into MS excel spread sheet and analyzed using SPSS 11.5 software (2002). Statistical analysis included comparison of GIT helminthes on the basis of age, sex, sampled areas. The prevalence in (%) was obtained by dividing the number of animals harboring a given helminthes to the total animal examined. P-value <0.05 was considered as statistically significant.

Results

Coproscopic Results

The present study revealed the existence of GIT helminthes in the study area with over all prevalence rates of 11.5% on the basis of coproscopical examinations. During this survey the GIT helminthes observed include Haemonchus sppTricostrongyles sppCooperia sppTricuris sppFasciola spp and Oesophagostomum spp which have significant importance both on health and economy. A different in prevalence rate of GIT helminthes between the young and adult camels was not statistically significant using x2 square analysis (p.>0.05) (Table 1). This shows that the prevalence rate of GIT helminthes was higher in young (18.18%) than adult camels (12.19%). In addition, analysis taken sex ways showed that the prevalence rate of GIT helminthes was higher in females than males. By x2 square analysis, the difference between prevalence of females (20%) and males (9%) was analyzed and found to statistically be not significant (p>0.05) (Table 2).

biomedres-openaccess-journal-bjstr

Table 1: Prevalence of GIT parasites in camel by age, irrespective of specie.

biomedres-openaccess-journal-bjstr

Table 2: Prevalence of GIT parasites in camel by sex, irrespective of species.

Postmortem Examination Result

A sample was collected from 50 adult camels and 5% of the samples were positive for different species of GIT helminthes. Based on sites on camels GIT and morphological appearance of the helminthes itself, the species of the helminthes was identified. As result, Haemonchus spp (4%), Trichostrongyles spp (2%), Tricuris spp (2%), and Fasciola spp (2%) were observed during postmortem examination. There was no mixed parasitic infestation in case of postmortem examination. On some occasions, Postmortem findings helped more in identifying exactly the species of parasites which was difficult during fecal eggs.

Occurrence of GIT Parasites in Different Study Areas

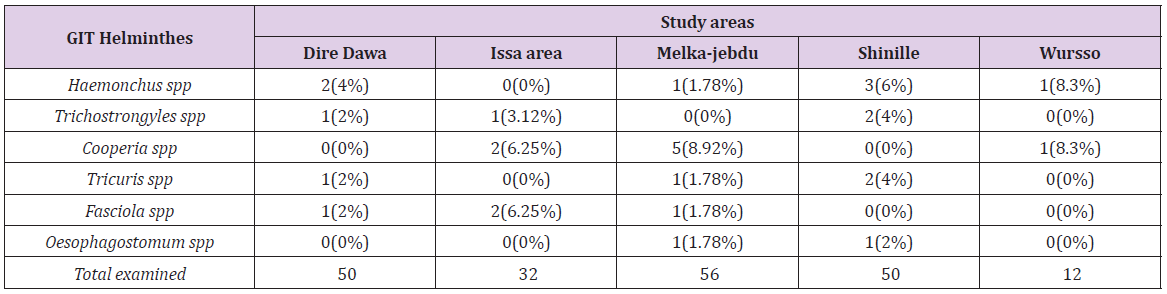
The frequency of occurrence of different parasites in different study areas irrespective of species shows presence of parasitic burden in all study areas. The frequencies of occurrences of different parasites in different study areas seemed almost the same (Table 3).

biomedres-openaccess-journal-bjstr

Table 3: Frequency of occurrence of different parasites in different study areas.

Discussion

This study revealed difference in the prevalence rate of GIT helminthes in coproscopic (29/200) and postmortem examination (5/50), which was 14.5% and 10% respectively. In addition, significant differences of GIT helminthes infestation between age groups, with higher infestation rate in young (18.18%) than adults (12.19%). this might be due to relative resistance of adult camels to GIT helminthes than younger. Similarities in frequencies of occurrences of GIT helminthes in the different study areas could be due to similarities in epidemiology and climatic conditions those study areas as well as their pastoral system of management. However, prevalence rates vary widely from region to region as well as from season to season within the same region [16]. Among those GIT helminthes examined, cooperia spp Oesophagostomum spp were absent in postmortem examination and Haemonchus spp (4%), Trichstrogyles spp (2%), Tricuris spp (2%), and Fasciola spp (2%) were prevalent. This could be due to resistance of adult camels for Cooperia spp and Oesophagostomum spp. this was agreed with survey done by [5,10,11].

Analysis that was taken in sex wise showed that the prevalence of GIT helminthes was higher in females (20%) than males (9%). This may be due to females being liable for many physiological stress-inducing factors like pregnancy and lactation [9]. There was no mixed infestation encountered during the study. This may be the reflection of pastures not being infected by different types of GIT helminthes. Camels acquire helminthes by grazing on infected pastures or ingesting larvae infected water [17]. During this survey the GIT helminthes found includes Haemonchus spp 7(3.5%), Trichostrongyles spp 4(2%), Cooperia spp 8(4%), Tricuris spp 4(2%), Fasciola spp 4 (2%) and Oesophagostonum spp 2(1%). Haemonchus spp (4%), Trichostrongyles spp (2%), Tricuris spp (2%) and Fasciola spp (2%).

Various works had documented; according to Rechards, [6] parasites encounter in Borena pastural area includes Trichostrongyles spp (85%), Strongloides (11%) and Tricuris spp (20%). In Harrargye pastural area, Birhanu, [7] reported Trichostrongyles spp (86%), Strongyloides (7.86%), Tricuris spp (43.6%) and cestodes (2.4%); Abebe, [8] reported Trichostrongyles spp (87.4%), Tricuris spp (49%) and cestodes (4.5%); Getachew, [9] reported Trichostrongyles spp (90.25%), Strongloids (10.7%), and Tricuris spp (28.9%) from Jigjiga and Lagahabur. Tenay, [10] reported Trichostrongyles spp (94.61%), Strongloids (8.09), Tricuris spp (45.6%) from Southern rangeland of Ethiopia (Borena). Theodros, [11] reported Trichostrongyles spp (94.61%), Strongloids (8.07%), Tricuris spp (72.43%) and cestodes (10%); Meles, [5] from Hararghe reported as Ttricostrongyles spp (86.94%), Strongloids (33.78%) and Tricuris spp (24.04%) and Ahmed, [2] in Eastern Ethiopia reported Trichostrongyles spp (71.3%), Haemonchus spp (64%), Nematodirus spp (34.8%), Tricuris spp (10.4%).In this study lower prevalence were reported as compared to those previous studies , this might be related to the wide use of antihelminthic drugs to the camels by owners that consequently reduce the overall prevalence rate in the study area.

Conclusion and Recommendations

The overall lower prevalence of GIT helminthes in camel of Dire Dawa and surrounding areas in this study suggests the natural resistance of the camel to the parasites due to the feeding habit and natural topography of the study areas as well as regular deworming habit of nomads. The study showed that Haemonchus spp and Cooperis spp, were found to be the most prevalent GIT helminthes in the study areas compared to other helminthes reported during the study. The result of present study has also revealed moderate spread of six GIT helminthes namely Haemonchus spp, Trichostrongyles spp, Cooperia spp, Tricuris spp and Oesophagostomum spp. Mixed infestation was not encountered both coproscopically and postmortem examinations. The prevalence rate of GIT helminthes was higher in young than adults and the prevalence rate was higher in females than males. Based on the above conclusive remarks the following recommendations are forwarded: 1. Public education about the importance of livestock management in parasite control.
2. Creating awareness on strategic parasite control methods.
3. Further epidemiological studies should be conducted in different agro-ecological zones and with different study designs.


For more Articles on: https://biomedres01.blogspot.com/
A Membrane-Active Anti-Microbial Peptide Demonstrates In Vitro Activity Against SARS-CoV-2 Infectivity

  A Membrane-Active Anti-Microbial Peptide Demonstrates In Vitro Activity Against SARS-CoV-2 Infectivity Introduction The ongoing coronaviru...