Lower Extremity Position Test: A Simple Quantitative Proprioception Assessment
Proprioception is the sense that enables to perceive the body’s movement and position, and permits smooth and coordinated motor performance. It includes sense of position and of movement, along with sense of weight and movement velocity and direction [1,2]. Balance and gait performance are correlated with lower extremity position sense acuity, and proprioceptive decline is correlated with mobility decline and with risk of falls [3,4]. Falls are the most frequent mechanism of injury in elderly population, with high economical cost [5]. Proprioception is deteriorating in average in older adults, as seen for other senses, but not necessarily in all [6,7]. Therefore, assessment of proprioception performance is of interest in order to plan appropriate prevention and treatment. Proprioception assessment has been widely addressed in the last years, and is agreed to be of importance for diagnosis, for impairment degree assessment, for change over time and for the evaluation of treatment effect [1,2,8,9].
However, to date quantitative methods are expensive and clinically unavailable, and therefore not in routine use [1]. Clinically, lower extremity proprioception is measured predominantly by assessing detection of movement and/or discrimination of movement direction, following passive movement of the joint; presenting categorical ratings (intact, impaired, absent; 0-1-2) [2,10].Thus, there is a need for a quantitative proprioception assessment tool that will meet requirements of psychometric properties and of clinical utility (in terms of cost, time to administer, limited need for special equipment and training, and portability) [1,10]. The brief kinesthesia test is such a quantitative tool for assessing upper extremity proprioception. It is brief, easy to administer, inexpensive, and able to evaluate performance in population of different ages, while offering a ratio scale [11].
Aim
The aim of this study was to develop a quantitative (ratio scale) proprioception assessment tool for the lower extremity as a functional structure (contrary to assessing a single joint), and to test its test-retest reliability and its known-groups validity between young and older adults. It was based on the concept of the brief kinesthesia test for the upper extremity [11] but uses passive movement in order to prevent motor direction information to intervene.
Methods
Participants
A convenience sample of 60 older adults (over 60 years-of-age) with no neurological disorders, and a control group of 20 healthy adults (18-30 years-of-age) was recruited. Older adult volunteers were tested at municipal centers for the elderly and in independentliving senior housing. Young volunteers were recruited from the university student body. Inclusion criteria were age related, walking ambulation in everyday living situations, and the cognitive ability to follow the test’s procedure. Exclusion criteria were a diagnosed neurological pathology (e.g. Parkinson’s disease, stroke, peripheral neuropathy) and reduced foot sensation determined by failure to identify touch of a 5.07 (10 gram) monofilament (in order to exclude undiagnosed peripheral neuropathies or other undiagnosed conditions of sensory loss) [12]. The study was approved by the Institutional Review Board of the Faculty of Social Welfare and Health Sciences at the university. All subjects provided written informed consent prior to enrollment.
Instrument and Testing Procedure
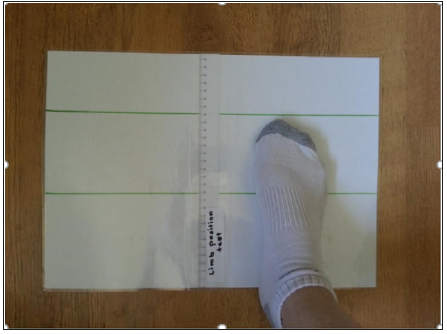
Instrument: A tool aimed to assess the proprioception ability of the lower extremity (forward reach with the foot in sitting position, combining movement of knee and ankle) was developed. The test kit was comprised of a thin sheet of plastic surface (A3 sized paper nyloned) taped to the floor. A ruler was placed along its middle to measure distance moved. Two lines were drawn at the 12 and 22cm, perpendicular to the ruler distance (Figure 1). The 12 and 22cm distances were chosen in order to standardize, on the basis of the upper extremity kinesthesia test, were medium and long distances only were found to be of use [11], and after trials with individuals of different height and leg length.
Testing Procedure
The subject was blindfolded and seated in a standard chair, with socks on (to eliminate friction and touch input as much as possible). A visual demonstration and a verbal explanation using the upper extremity were provided to ensure the instructions were understood. The test was performed with a slow passive movement of the foot on the plastic surface, repeated twice. The movement was administered by the tester, starting at the edge of the plastic surface (0cm on the ruler), with no active movement by the subject, to eliminate motor knowledge interference. For each repetition, the tester first moved the foot, so the toes reached either the 12cm or the 22cm line, brought it back to the starting point; then, moved it again to the point where the subject said “stop”. The difference between the designated distance and the point where the subject asked to stop the movement was measured in half centimeters (0.5cm). The test was held twice for each distance for both feet, in a random order between distances and feet, and an average of mismatch was calculated for each distance.
Study Procedure
Prospective data gathering was planned, following the tool development procedure. All subjects were tested by the same tester on two occasions, one week apart. Demographic data, including age and gender were collected from all participants. Walking independence and the use of assistive device were gathered for older volunteers.
Statistical Analysis
Descriptive statistics of subjects’ characteristics and the test results included mean, standard deviation (SD) and range. T-test (2,2) was performed to determine differences in scores between groups, in order to verify known-groups validity [13]. T-test (2,1) was performed to determine differences in scores between right and left leg performance within group. Test retest reliability was analyzed with the intraclass correlation analysis (ICC2,1). The interpretation of the ICC was: 0-0.25 little to no correlation; 0.26–0.50 fair degree of correlation; 0.51–0.75 moderate to good correlation; and 0.76 –1 good to excellent correlation [13]. Bland- Altman analysis was used to determine absolute reliability, as determined by the 95% repeatability measure, which is the 95% precision interval for repeated tests under similar condition [14].
Results
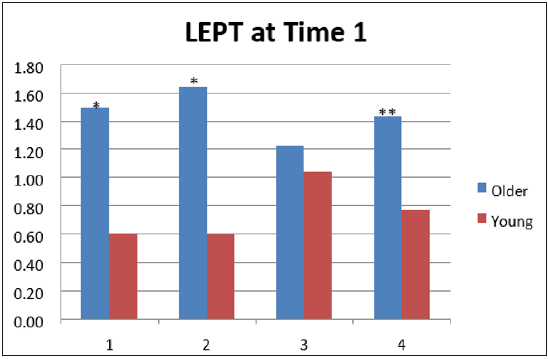
A total of 80 subjects (60 older adults and a control group of 20 young adults) met the inclusion criteria and volunteered to participate in the study. Subject characteristics are provided in Table 1. The mean and standard deviation for the position test score (per group, distance in cm, extremity and testing session) are presented in Table 2. T-test (2,1) found no significant differences for the older subjects’ group between right and left legs’ performance. For the young subjects’ group no significant difference was found for the 12cm distance, but the 22cm distance showed significant difference (p=0.04), as the left leg performed better with a smaller mismatch (0.76±0.46) then the left leg (1.04± 0.37) at time1. T-test (2,2) found significant differences for right 12cm (p=0.04), for left 12 cm (p=0.02), and for left 22cm (p=0.01). The difference for right 22cm was not found significant Figure 2 demonstrates the mean deviation distance, thus the movement reproduction error, for right/ left leg for the 12 and 22cm distances tested at time 1.
Table 2: Deviations (cm) of lower extremity from the 12/ 22 cm target per group, leg and testing session (mean ± standard deviation (range).
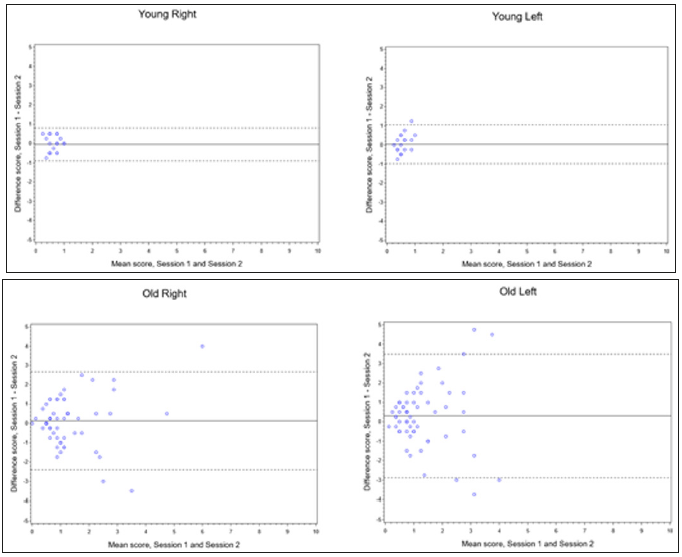
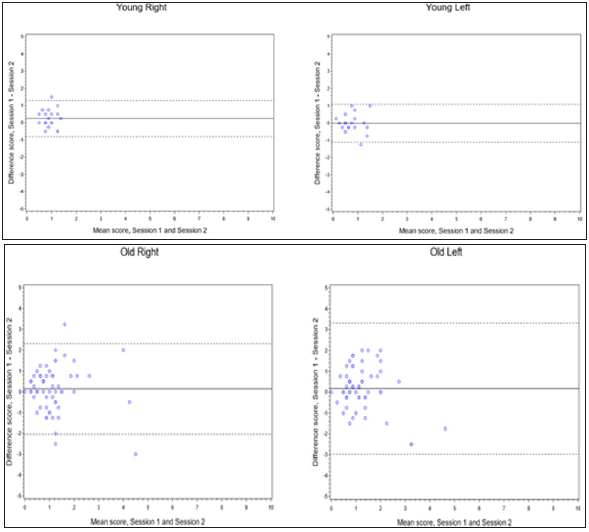
The results of the test-retest analysis are presented in Table 3. Good test-retest reliability was also demonstrated for the right leg of the older subjects’ group for the 12cm and 22cm distances (ICC=0.60 and 0.62, respectively). Fair reliability was demonstrated for older subjects’ left leg for the 12cm and 22cm distances (ICC=0.33 and 0.38 respectively). Poor reliability was found for both distances and legs of the young subjects. The results of the testretest analysis are presented in Table 3. Good test-retest reliability was also demonstrated for the right leg of the older subjects’ group for the 12cm and 22cm distances (ICC=0.60 and 0.62, respectively). Fair reliability was demonstrated for older subjects’ left leg for the 12cm and 22cm distances (ICC=0.33 and 0.38 respectively). Poor reliability was found for both distances and legs of the young subjects. Results for Bland-Altman plots are presented in Figures 3 & 4 For the 12cm distance, the intra-tester 95% repeatability results ranged from -3.01 to 3.59 and from 3.50 and 4.45 in older subjects for the right and left feet, respectively; and from -0.90 to 0.80 and -0.98 to 1.05 for the young subjects for the right and left feet, respectively. The intra-tester 95% repeatability results ranged, for the 22cm distance, from -2.05 to 2.31 and 2.97 to 3.32 among older subjects for the right and left feet, respectively; and from -0.80 to 1.28 and from -1.11 to 1.08 for the young subjects for the right and left feet, respectively. No or minimal bias was demonstrated.
Figure 3: Bland-Altman plots for agreement between two testing sessions, position test, 12 cm distance (solid line, mean difference between testing sessions; dashed line, limits of agreement).
Figure 4: Bland-Altman plots for agreement between two testing sessions, position test, 22 cm distance (solid line, mean difference between testing sessions; dashed line, limits of agreement).
Discussion
The newly developed LEPT, a quantitative tool to assess proprioception performance of the lower extremity, was examined in this study. By reproducing distances of passive combined knee and ankle movements using a simple and cheap tool, a ratio scale assessment is obtained. It stands well with requirements of psychometric properties and does not require special equipment or training, is easily portable, and conforms to measures of clinical utility [10]. Overall, the study found differences in performance between old and young population, no difference between right and left lower extremities in older individuals, but a difference in young in the 22cm distance. These findings justify the use of the Lower Extremity Position Test (LEPT) for testing the characteristic of intact or impaired proprioception of the lower extremity in older adults, through known groups validity [13]. Variability of outcomes was much wider in the older adult group, as shown in the Bland- Altman analysis, and as suggested in earlier literature [6,15].
A review by Goble et al. [6] reported that single joint proprioception matching tasks are performed with greater mismatch in elderly than in young participants in most studies, due to greater variability in individual performance. If an assessment tool is able to capture this variability in older adults, as opposed to homogeneity in young adults, it may suggest that this tool is sensitive to changes in proprioception with age in healthy older individuals. The ICC values indicated fair to good test-retest reliability for the assessment of the older subjects, suggesting the suitability of the tool for the assessment of these populations. In contrast, test-retest reliability for young, healthy individuals was poor. Similar poor test - retest reliability has been reported with unimpaired individuals in tests of thermal thresholds [16,17]. Since ICC depends on between subject variability, the ICC appears very low when the range of results is very narrow and is suggested not to be the relevant statistic for use [18]. In our group of young subjects, most distance reproductions were within one cm error at most. Thus, the range of error is very narrow, and the ICC appears very low, accordingly.
However, the narrow agreement range for this subject group observed, with the Bland-Altman plots, assures a minor difference in scores between tests when testing individuals with intact sensory function [19]. Differences in ICC results between left and right, for healthy young and older groups, and difference in t-test between right and left 22cm distance in young, could be explained by prior findings of differences in position-matching ability between dominant and non-dominant upper extremities. Matching appears to be more accurate with the non-dominant upper extremity, and differences in acuity grow with cognitive demand [20]. With regard to the tool presented here, accuracy with increasing cognitive demand, or under different attention conditions, needs to be further investigated. This new assessment tool can be used for both screening and diagnosis purposes and for surveillance and treatment effectiveness outcome assessment, as replacement or add-on tool to existing non-quantitative clinical testing.
Study Limitations
a) This tool assesses combined movement of knee and ankle, and the exact motion of each within the general movement is not controlled;
b) Intertester reliability was not tested in this study;
c) While proprioceptive function of the lower extremity is primarily important during standing and walking, the test was conducted in the seated position. Therefore, its relevance to functional performance needs to be further validated [21]
d) Our choice of older population without sensory loss (exclusion of neuropathies and failure to detect the 5.07 monofilament might lead to a “healthier than general population” subject group.
Suggestion for Further Research
We suggest that additional studies be conducted to validate this tool with a wide population of older adults of different age groups (old versus very old), and in individuals with neurological diagnoses. Further we suggest assessing the need for both short (12cm) and long (22cm) distances. As clinical assessment of proprioception is usually performed by detecting passive movement and its direction, correlation of the proposed tool with the conventional method should be studied, and advantages of the new tool highlighted. Additional studies should evaluate correlations between this new assessment instrument and existing laboratory tools, such as post urography, etc. We would like to further investigate the variability of outcomes in elderly and correlations to fear of falls and actual falls.
Conclusion
The LEPT is a reliable and valid tool for the assessment of proprioception of the lower extremity in older adult population.
The Effect of Granulocyte Colony Stimulating Factors (GCSF) on Expansion of CD34+ Hematopoietic Stem Cells-https://biomedres01.blogspot.com/2020/11/the-effect-of-granulocyte-colony.html
More BJSTR Articles : https://biomedres01.blogspot.com


No comments:
Post a Comment
Note: Only a member of this blog may post a comment.