In vitro Cytotoxic Effects of Control and Selenium Conjugated Transferrins against Leukemia Cell Lines K562 and THP-1
Holo-transferrin (Tf) binds iron (Fe) from the epithelial intestine cells and transports it into liver tissue and other cells [1]. Two types of transferrin receptors are found on the cell surface of plasma membranes; transferrin receptor 1 (TfR1) [2] and transferrin receptor 2 (TfR2) [3]. Holo-transferrin has a higher affinity for TfR1 than TfR2 and TfR1 is more abundantly expressed on cell membranes than TfR2. Almost every cell that requires Fe, expresses TfR1 having two distinct cytoplasmic domains; an extended anchored hydrophobic membrane and exocytic region of the protein [4]. Extensive research now suggests that Fe bound transferrin is internally transported by mediated endocytosis [5]. On rapidly dividing cancer cells, approximately 10,000 to 100,000 TfR1 receptor molecules are over-expressed per cell [6]. On normal cells, however, expression of TfR1 is generally low or undetectable. Holo-transferrin delivers Fe to human leukemia hematopoietic stem cells, cells characterized by uncontrolled proliferation.
Many leukemias and other rapidly proliferating cancer cell lines as noted will over-express the trans-membrane transferrin receptor (TfR1) protein for Holo-transferrin (Holo-Tf) [2,7-8]. This reported over-expression of the TfR membrane receptor has permitted experimental transferrin-mediated drug delivery of redox selenium targeting leukemia cells [9-12]. Selenium compounds that form transient or stable selenides (RSe-) will oxidize cellular thiols and redox cycle generating O2.- and other ROS [13-15]. Toxicity of all selenium compounds is both concentration and specie specific as shown by the many in vitro experiments against cancer cells [16-18]. The in vitro selenium toxicity is not just specie and concentration dependent, but also diffusion dependent. This study describes experiments showing that redox Se can be covalently attached to Apo-, Holo-Tf, and Human Serum Albumin (HuSA) using a Se-modified Bolton-Hunter reagent and that all three conjugated Se-proteins used in these experiments, but not native proteins, are cytotoxic to CML K562, and AML THP- 1 cells in vitro. Cytotoxicity of the Se-conjugates, like selenite, is concentration, dose, and time dependent. The modified Bolton- Hunter attachment and cytotoxicity of redox Se of these proteins suggests a general therapeutic technique that has also been shown in vitro to be applicable to monoclonal antibodies.
Reagents
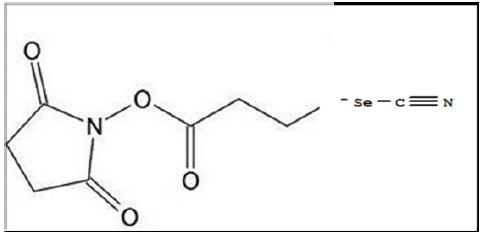
The N-hydroxysuccinamide ester of 3-selenocyanopropionic acid (modified Bolton-Hunter reagent; (Figure 1) was synthesized by a Dicyclohexylcarbodiamide (DCC) reaction between 3-selenocyanoproprionic acid and N-hydroxysuccinimide. The synthesis was performed for us by Eburon Organics Belgium, Inc., at Gujarat, India. The final reagent is brick-red in color, soluble in Tetrahydrofuran (THF), and was used without further analysis following filtration. Sodium selenite, Tetrahydrofuran, Apotransferrin, Holo-transferrin, and Human Serum Albumin were obtained from Lee Biosolutions, St. Louis, MO. Other reagents were from Sigma-Aldrich, St. Louis, MO and were reagent grade or better unless otherwise noted.
Selenium-Protein Conjugation with the Se-Modified Bolton-Hunter Reagent
The N-hydroxysuccinimide ester of 3-selenocyanopropionic acid, Se-modified Bolton-Hunter Reagent (Figure 1) was dissolved in THF at a concentration of 20 mg/ml. Two and half milliliters of the Se-Bolton-Hunter reagent dissolved in THF was added into 10 ml of protein (2.5 mg/protein/ml) in sodium borate buffer pH 8.5 and incubated for 48 hours on ice under refrigeration. After 48 hrs of 4°C conjugation, the Se-conjugated proteins were dialyzed (Specta/Por membrane, Rancho Dominguez, CA) with a MW cut off of 50,000 against PBS (pH 7.4) over 3 days (500 ml of dialysis buffer changed at least 3 to 4 times) to remove any unreacted selenoester, N-hydroxysuccinimide, borate or low molecular weight compounds. The pH of the protein dialysates were checked to be pH 7.4 and were then passed through a Millipore 0.22 micron filter into sterile 15 ml test tubes.
Figure 1: Selenium- Modified Bolton-Hunter Reagent. Dark-Red in color.
Leukemia Cells and Cell Culture
Human chronic myelogenous K562 leukemia cells were purchased from ATCC (Cat # CCL-243, Manassas, VA), and human acute monocytic THP-1 leukemia cells were generously provided by Dr. Kai Zhang, Department of Biology, Texas Tech University, Lubbock, TX. Both cell lines were maintained in RPMI 1640 (ATCC Cat# 30-2001, Manassas, VA) and supplemented with fetal bovine serum to a final concentration of 10% (v/v). Cells were propagated in suspension in a humidified atmosphere of 95% air and 5% CO2 at 37°C. Fresh growth medium was uniformly renewed every 2 or 3 days. Cell densities were maintained at 1 X 10⁶ cells/ml before passage.
Protein Electrophoresis
All Se-conjugated proteins (2.5 mg/protein/ml) and native proteins (2.5 mg/protein/ml) were subjected to electrophoresis on an 8% acrylamide gel (50 μg protein/lane) with a molecular protein marker under non-reducing conditions for one-and-half hours at 120V (Bio -Rad Mini-Protean Tetra System, Life Sciences Research, Hercules, CA). Electrophoresis was followed by Coomassie Blue staining and photographed with a gel scanner (Li-Cor Bioscience, Odyssey CLX, Lincoln, NE).
Control and Selenium Cell Treatments
Both K562 and THP-1 cells were seeded with RPMI 1640 phenol red free medium (Life Technologies, GIBCO 11835-030, Carlsbad, CA) at a density of 1 X 10⁵ cells/well into 24-well plates for the quantitative cytotoxicity cell assays. For the apoptosis assay, cells were seeded at a concentration of 3 X 10⁶ cells/well. Cells were treated in triplicates with Se-Apo-Tf-, Se-Holo-Tf, and Se-HuSA at Se concentrations ranging between 1.2 μg to 19.2 μg Se/mg protein/ well for 24, 48, 72, 96, and 120 hours. All treatment data was compared to data from control cells and cells incubated with native proteins in PBS, pH 7.4 at corresponding protein concentrations. Sodium selenite (1 or 10 μgSe/well) was used concurrently as a positive control for assessing cell death in all cytotoxic cell treatment assays.
Trypan Blue Assay and Spectrophotometry
Cells were seeded to a concentration of 1 X 10⁵ cells/well in 12-well plates. After 72 hours of incubation post-treated cells were stained with Trypan Blue (TB, 10 μl/well) after which total and live cells were counted using a hemocytometer (Fisher Scientific, Taiwan). Cells were then seeded at a concentration of 1 X 10⁵ cells/ well in 12-well plates. Se-Holo-Tf, Se-Apo-Tf, and Se-HuSA were used to treat cells at the different selenium concentrations and were initially incubated for 48 hours. Control cells were treated with a corresponding concentration of native protein. Ten microliters of TB was then added to each well and incubated at room temperature for 30 minutes. Optical density (OD) of each well was automatically recorded at 450 nm using a microtiter plate reader (BioTek Synergy H1, Winooski, VT).
Cells were seeded at a density of 1 X 10⁵ cells/well. A (5 mg/ ml) 10% (v/v) solution of 3-[4, 5-dimethylthioazol-2-yl]-2-5- diphenyltetrazoliumbromide (MTT) was added to each well of control, selenoprotein and selenite treated cells. The water insoluble formazan generated by viable cells was solubilized using equal amounts, 50/50, of Tween-20 and isopropanol/well) and the absorbance of the solubilized formazan was automatically read at both 570 and 690 nm using a microplate reader (BioTek Synergy H1, Winooski, VT).
Caspase-3 Apoptotic Enzymatic Assay
Both K562 and THP-1 cell lines were seeded to a density of 1 X 10⁶ cells/well in 24-well plates and incubated with different concentrations of Se-Apo-Tf, Se-Holo-Tf, Se-HuSA, or selenite. Again, cells without any treatment or cells with equal amounts of added protein served as controls. Following treatments cells were lysed with a lysis buffer and protein concentrations were determined using the protein BCA kit as provide by the supplier (Fisher, Waltham, MA). Activity of Caspase-3 was quantified following the manufacturer’s instructions using a microtiter plate reader by automatically reading the absorption at 400 nm (BioTek Synergy H1, Winooski, VT).
Live Dead Cell Flow Cytometry Assay
A quantitative analysis was performed using a Live and Dead cell viability assay kit (Life Technologies, Grand Island, NY). Cells were seeded at a concentration of 1 X 10⁶ cells/well in 24-well plates and incubated with native proteins, the Se-protein conjugates, or selenite. Live cells staining with fluorescence C12-Resazurin (red) and dead cells staining with SYTOX (green) were analyzed for viability (10,000 cells/ treatment) using a flow cytometer (BD Accuri C6, Franklin Lakes, NJ).
Statistical Analyses
All experimental cell assays were conducted in triplicate or more replications and are representative of three or more independent experiments. The data are expressed as the Mean ± Standard Deviation (SD). The statistical analyses were performed using the Microsoft Excel 2007 two-tailed independent t-test, single factor ANOVA, logarithmic trend line, and linear regression analysis software. Levels of significance between and among calculations are indicated as; p < 0.05 (*), p < 0.01 (**), and p < 0.001 (***).
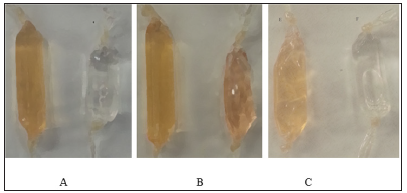
Following redox Se conjugation to the proteins by the Semodified Bolton-Hunter reagent at pH 8.5 the orange-colored proteins (Figure 2) Apo-Tf, Holo-Tf, and HuSA were subjected to exhaustive dialysis and filtration. The conjugated protein Se content was then analyzed by inductively coupled plasma mass spectrometry (ICP-MS) by TraceAnalysis, Inc., Lubbock, TX. The reported dialyzed Se-Apo-Tf, Se-Holo-Tf, and Se-HuSA Se concentrations were 14.6 ± 2.9, 12.0 ± 3.5, and 15.1 ± 3.9 μgSe/ mg protein respectively after the 48-hour refrigerated conjugation time in borate buffer. Native proteins, Apo-Tf, Holo-Tf, and HuSA, treated equally, were reported by TraceAnalysis, Inc. to contain 0.18, 0.10, and 0.10 μgSe/mg protein respectively. Moreover, all native proteins were analyzed by ICP-MS for their Fe content by TraceAnalysis Inc. and it was reported that the amount of Fe in Apo-Tf and HuSA was ≤ 0.1 μg/Fe/mg protein, whereas, Holo-Tf contained 4.6 μgFe/mg protein.
Note: A. Se-Apo-Tf and Native Apo-Tf; B. Se-Holo-Tf and Native Holo-Tf; C. Se-HuSA and Native HuSA.
Figure 2: Transferrins and Human Serum Albumin (right) pictured with Selenium Conjugated Seleno-Transferrins and Human Serum Albumin (left) following Dialysis.
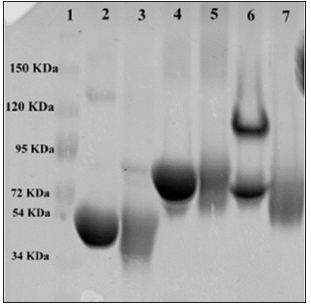
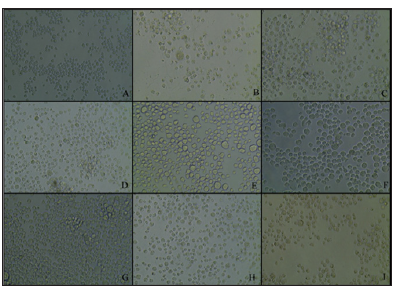
In order to evaluate the homogeneity of the of the Seconjugated proteins, Apo-Tf, Holo-Tf, and HuSA and native proteins (50 μg protein/lane) were subjected to electrophoresis on an 8% acrylamide gel along with a mixture of molecular protein markers (Fisher Scientific, Pittsburg, PA) under non-reducing conditions for 1.5 hours at 120V, followed by Coomassie Blue staining. The homogeniety of the proteins are shown in Figure 3. Holo-Tf revealed 2 bands in Figure 3 but a second separate electrophoresis assay to duplicate the 2 bands revealed only one single band at approximately 72,000 MW (not shown). Selenium conjugation did not appear to significantly augment the native protein molecular electrophoresis. Both K562 and THP-1 cells were initially treated with 9.6 μgSe/well (to approximate the expected toxic selenite treatment, 10 μg Se/well, of Se-Apo-Tf, Se-Holo-Tf, and Se-HuSA in 24 well plates. Photographic images of the cells were taken under phase contrast light microscopy at 20X magnification after 48 hours post-treatment. Both K562 and THP-1 cells treated with Se-Apo-Tf showed membrane disruption and less cell viability as assessed visually by light microscopy and by Trypan Blue staining.
Note: Lane 1: molecular weight markers (34-150 KDa), Lane 2: Native HuSA, Lane 3: Se-HuSA, Lane 4: Native Apo-Tf, Lane 5: Se-Apo-Tf, Lane 6: Native Holo-Tf, and Lane 7: Se-Holo-Tf. Protein bands migrated to ~80 KDa for Apo-Tf and SeApo-Tf, ~72 KDa for Holo-Tf and Se-Holo-Tf, and ~40 KDa for HuSA and Se-HuSA. The molecular weights of Native Apo-Tf and Se-Apo- Tf, Native Holo-Tf and Se-Holo-Tf, and Native HuSA and Se-HuSA appear to be similar by electrophoresis. The additional band found in Lane 6 (Native Holo-Tf) may represent a non-iron conjugated Holo-Tf. The homogeniety of Native Holo-Tf and Se-Holo-Tf were evaluated by second a SDS-PAGE gel run and the protein bands were shown to be ~72 KDa (data not shown).
Figure 3: Gel Electrophoresis of Control, Selenium Conjugated Transferrins, and Human Serum Albumin
Note: A: K562 control cells after 48 hours with 1× PBS; B: SeApo-Tf treated cells, showed membrane rupture and less cell viability; C: SeHolo-Tf treated cells, swelled cells with cell membrane damage; D: SeHuSA treated cells with less number and damaged cells; E: native Apo-Tf treated cells with higher cell viability; F: native Holo-Tf treated cells with high cell viability; G: native HuSA treated cells with high cell viability; H: selenite (10 μg Se) treated cells with lower cell viability; I: selenite (1 μg Se) treated cells with greater number of cells but with some abnormal cell morphology.
Figure 4: K562 Cell Morphology at 48 Hours Photographed after Selenium Treatments.
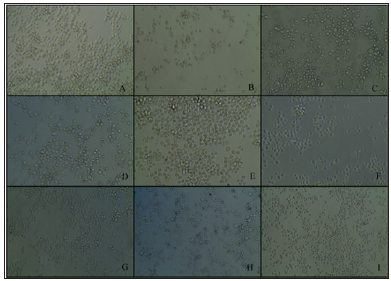
Cells treated with Se-Holo-Tf demonstrated early stages of cytotoxicity and membrane blebbing (Figures 4 & 5). Se-HuSA treated cells revealed less damaged and more normal (control) looking cells. Native Apo-Tf, Holo-Tf, and HuSA treated cells all looked similar to normal (control) cells with high cell viability as assessed by TB staining. Selenite (10 μgSe/well) treated cells expressed much lower absolute cell density and extensive membrane damage in comparison to control cells. Selenite (1 μgSe/ well) treated cells contained a higher number of and more normal looking cells with very few cells with any abnormal membrane morphology.K562 cells seeded at a concentration of 1 X 10⁵ cells /well in 24-well plates were treated after 24 hours with 0.6, 1.2, and 2.4 μg Se-conjugated Apo-Tf, Holo-Tf, and HuSA. After 96 hours Trypan Blue spectrophotometry revealed only slight cytotoxic effects of the Se-conjugated proteins at the 2.4 μgSe concentration. There were no cytotoxic effects as measured by TB absorption in the THP-1 cell line after 72 hours post treatment with 0.6, 1.2, and 2.4 μgSe-conjugated Apo-Tf.
Note: TreatmentsTHP-1 cells were seeded to a concentration of 1×10⁶ cells/well and after 24 hours, cells were treated with selenoproteins at 9.6 μg Se/mg protein/well. A: THP-1 control cells after 48 hours with 1× PBS; B: SeApo-Tf treated cells, membrane ruptured and less cell viability was found; C: SeHolo-Tf treated cells, cell shrinkage with cell membrane damage; D: SeHuSA less cells and cell membrane damage was found; E: native Apo-Tf higher cell viability and cell swelling found; F: native Holo-Tf treated cells showsimilar effects with native Apo-Tf treatment; G: native HuSA treated cells, show higher cell viability and cell swelling; H: selenite (10 μg Se) and I: selenite (1 μg Se) treated cells, both with lower cell viability and with disrupted cell membranes.
Figure 5: THP-1 Cell Morphology at 48 Hours Photographed after Selenium.
Note: K562 cells were seeded at a concentration of 1×10⁵ cells /well in a 24-well plates and treated after 24 hours with 0.6, 1.2, and 2.4 μg Se-conjugated Apo-Tf, Holo-Tf, and HuSA for 96 hours. The results show the cytotoxic effects of the Se-conjugated proteins and selenite compared to control cells as measured at 490 nm for Trypan Blue . All data are expressed as the Mean ± Standard Deviation (SD) (n=3). The statistical analyses were performed using the Microsoft Excel 2007 two-tail, unpaired independent t-test, ** p < 0.01, and ***p < 0.001.
Figure 6:Cell Viability of K562 Cells (%Live Cells) by Trypan Blue Exclusion.
Selenite at 10 μgSe/well, used again as a positive control for cell arrest in these 96 hour and 72-hour assays of control and Se-conjugated proteins revealed fewer cells and extensive morphological changes. A significantly greater cytotoxicity (*p < 0.05) than control cells was determined for the K562 and THP-1 cells (data not shown) treated with the Se-proteins as assessed by TB absorption in Figure 6. Actual TB measurements at 96 hours post-treatment with 2.4 μgSe treated Se-Apo-Tf, Se-Holo-Tf, and Se- HuSA determined 16.4 ± 3.2, 25.6 ± 13.0, and 38.8 ± 8.9 percent live cell viability, respectively. At 72 hours post-treatment with 0.6, 1.2, and 2.4 μg Se-conjugated Apo-Tf, 44.2 ± 28.3, 41.9 ± 46.5, and 25.7 ± 19.8 percent of the cells were viable, respectively. Cells treated with selenium as selenite (10 μgSe/well) at 96 hours (K562) and 72 hours (THP-1) post-treatmment had TB absorption values of 9.0 ± 2.6 and 3.8 ± 3.6 percent cell viability, which was significantly different compared to control cells, which were 75 ± 17.7 and 50.4 ± 28.4 percent cell viability (*p < 0.05).
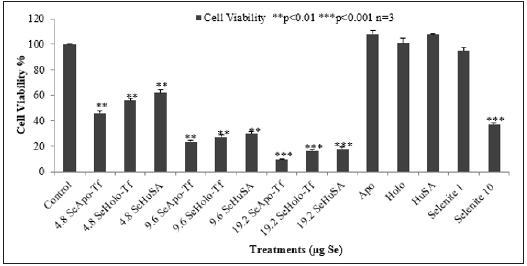
The alternative cytotoxic assay of cell viability to TB exculsion is the enzymatic MTT assay (3-[4, 5-dimethylthioazol-2-yl]-2- 5-diphenyltetrazoliumbromide). As TB revealed only marginal cytotoxic effects of the Se-conjugated proteins at 2.4 μgSe/well, 1 X 10⁵ K562 cells were treated for Se viability for 96 hours with increased Se concentrations; 4.8, 9.6, and 19.2 μg Se/well of conjugated proteins (Figure 7). Selenite (10 μgSe/well) was again used as a positve control for cell death. Se-Apo-Tf, Se-Holo-Tf, and Se-HuSA, all significantly decreased the rates of cell proliferation (**p < 0.01). At the highest Se concentrations of 19.2 μgSe/well, Se-Apo-Tf, Se-Holo-Tf, and Se-HuSA all treatments showed less than 20% cell viability (***p < 0.001) compared to control cells. Selenite (10 μg Se/well) resulted in cell viability of less than 35% after 96 hours of incubation. It was somewhat suprising to see all the Se-protein treatments producing greater cytotoxicity than the 10 μgSe selenite treated cells. Se as selenite (1 μgSe/well) showed no cytotoxicity when compared to control or native protein treated cells.
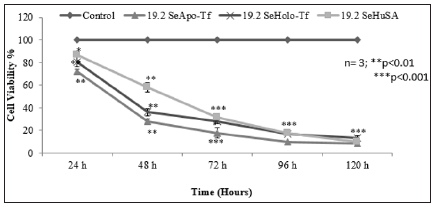
Note: K562 cells were treated with 4.8 μg, 9.6 μg and 19.2 μg SeApo-Tf, SeHolo-Tf, and Se-HuSA for 24, 48, 72, 96, and 120 hours. 10 μg Se/well as selenite treated as a positive control and 1 μg Se/well had no inihibiotry effect on K562. All data are expressed as the Mean ± Standard Deviation (SD) (n=3). The statistical analyses were performed using the Microsoft Excel 2007 two-tail, unpaired independent t-test and one way ANOVA, *p < 0.05, ** p < 0.01, and ***p < 0.001.
Figure 7: Dose and Time Dependent Cell Viability of K562 Cells by the MTT Assay.
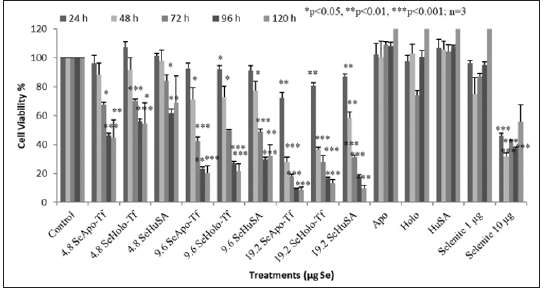
To measure both the dose and time dependent cell proliferation effects of Se-Apo-Tf, Se-Holo-Tf, and Se-HuSA, 1 X 10⁵, K562 cells were treated with 4.8 μg, 9.6 μg and 19.2 μg Se-Apo-Tf, Se-Holo-Tf, and Se-HuSA. Cells were then incubated for 24, 48, 72, 96, and 120 hours and cell viability at each time period was measured using the MTT assay as shown in Figure 7. All Se treatments, except the 1 μgSe/well treatment as selenite as a function of dose, all showed decreasing cell viability at 72, 96, and 120 hours post-treatment. The most significant decrease in cell proliferation over time was by Se-Apo-Tf as evidenced in the 19.2 μgSe/well treatments incubated between 48, 72, 96, and 120 hours. At all lower Se concentrations, significant (*p < 0.05 or **p < 0.01) loss of cell viability was also observed. Selenium as selenite, showed significant (***p < 0.001) inhibition of cell viability at 10 μgSe/well at all time periods and 1 μg Se/well again had no inihibiotry effect on K562 cell viabilty at any time period. Control cells receiving native proteins alone even at the highest protein concentrations all showed high cell viability at all time periods; i.e. , no toxicty.
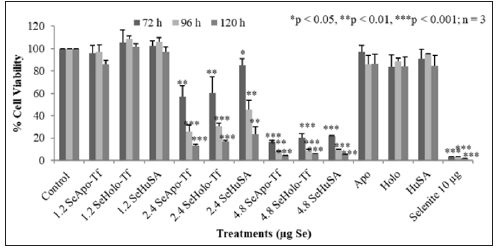
THP-1 cells were treated with 1.2 μg, 2.4 μg, and 4.8 μgSe/ well with Se-Apo-Tf, Se-Holo-Tf, Se-HuSA or 10 μgSe/well as selenite for 72, 96, and 120 hours (Figure 8). A significant (**p < 0.01) decreased in cell viability was noted at all selenoprotein concentrations, except the 1.2 μgSe/well, over all time periods (***p < 0.001) Over all other treatment times, 72, 96, and 120 hours and Se concentrations, THP-1 cells showed approximately 80 to 90% reduction in cell viability in comparison to the control cells and viability was significantly different from control cells (p < 0.001). Dose dependant calculations of selenium toxicity were used to determine the IC50s of Se-Apo-Tf, Se-Holo-Tf, and Se-HuSA of K562 and THP-1cell viabilities at 96 hrs. The IC50 of Se-Apo-Tf,Se-Holo-Tf, and Se-HuSA with the K562 cells were 3.28, 3.98, and 4.76 μgSe/mg protein from Figure 9 and the IC50 of the THP-1 cells were 2.03, 2.12, and 2.29 μgSe/mg protein from Figure 10 respectively. All IC50 calculations were generated from the graphic dose response curve (μg Se/mg protein) and the logarithmic trendline was calculated from the resulting graphic data using the Microsoft Excel 2007 statistical software.
Note: THP-1 cells were treated with 1.2 μg, 2.4 μg and 4.8 μg SeApo-Tf, SeHolo-Tf, and Se-HuSA for 72, 96, and 120 hours. 10 μg Se/well as selenite was treated as a positive control. All data are expressed as the Mean ± Standard Deviation (SD) (n=3). The statistical analyses were performed using the Microsoft Excel 2007 two-tail, unpaired independent t-test and one way ANOVA, *p < 0.05, ** p < 0.01, and ***p < 0.001.
Figure 8: Dose and Time Dependent Cell Viability of THP-1 Cells by the MTT Assay.
Note: K562 control cells and 19.2 μgSe/well conjugated Apo-Tf, Holo-Tf, and Se-HuSA were treated for 24, 48, 72, 96, and 120 hours and then viability was assessed by an MTT assay. All data are expressed as the Mean ± Standard Deviation (SD) (n=3). The statistical analyses were performed using the Microsoft Excel 2007 two-tail, unpaired independent t-test, *p < 0.05, ** p < 0.01, and ***p < 0.001.
Figure 9: MTT Assay of Time Dependent Cell Viability of K562 Cells at Highest Selenium Protein Concentrations.
Note: THP-1 control cells and 4.8 μgSe/well conjugated Apo-Tf, Holo-Tf, and Se-HuSA were treated for 72, 96, and 120 hours and then viability was assessed by an MTT assay. All data are expressed as the Mean ± Standard Deviation (SD) (n=3). The statistical analyses were performed using the Microsoft Excel 2007 two-tail, unpaired independent t-test, *p < 0.05, ** p < 0.01, and ***p < 0.001.
Figure 10: MTT Assay of Time Dependent Cell Viability of THP-1 Cells at Highest Selenium Protein Concentrations.
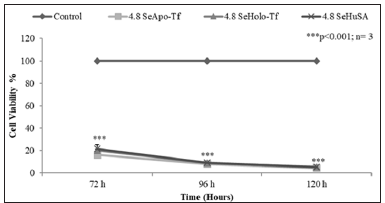
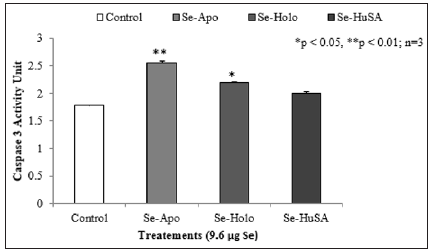
The data indicated that the THP-1 leukmia cells were approximately 2X more sensative to the selenium protein treatments than the K562 cells.To assess if apoptosis might be a cause of cell death, a Caspase-3 enzymatic assay was performed on both K562 and THP-1 selenium treated cells. K562 cells were seeded at a concentration of 3 X 10⁶ cells/well and treated with 9.6 μgSe/well of Se-conjugated Apo-Tf, Holo-Tf, and HuSA for 48 hours. As indicated by the mean caspase activity units, Se-Apo-Tf and Se- Holo-Tf triggered measureable activation of Caspase-3 after 48 hours of incubation (Figure 11). Se-Apo-Tf and Se-Holo-Tf increased Caspase-3 1.5 fold and 1 fold respectively, compared to measured Caspase-3 from the control cells. All Caspase-3 experiments were done in triplicate and the increase in Caspase-3 was significant; (p < 0.05 or p < 0.01) in Se-transferrin treated cells but not Se-HuSA which showed no significant statistical increase in activation of Caspase-3 over control cells [7-10].
Note: K562 cells were seeded at a concentration of 3 × 10⁶ cells/well and treated with 9.6 μg Se/well of Se-conjugated Apo-Tf, Holo-Tf, and HuSA for 48 hours. Se-Apo-Tf and Se-Holo-Tf increased caspase 3 1.5 fold and 1 fold, respectively, compared to measured caspase 3 from the control cells. All data are expressed as the Mean ± Standard Deviation (SD) (n=3). The statistical analyses were performed using the Microsoft Excel 2007 two-tail, unpaired independent t-test, *p < 0.05 and ** p < 0.01.
Figure 11: MTT Assay of Time Dependent Cell Viability of THP-1 Cells at Highest Selenium Protein Concentrations.
Note: THP-1 cells were also seeded to a concentration of 3 × 10⁶ cells/well and were treated with 4.8 μg Se/well of Seconjugated Apo-, Holo-Tf, and HuSA for 72 hours. Only Se-HuSA showed a statistically significant (p < 0.05) caspase 3 increase in comparison to the control cells. All data are expressed as the Mean ± Standard Deviation (SD) (n=6). The statistical analyses were performed using the Microsoft Excel 2007 two-tail, unpaired independent t-test, *p < 0.05.
Figure 12: Caspase 3 Activity Units from THP-1 Cell Selenium Treatments.
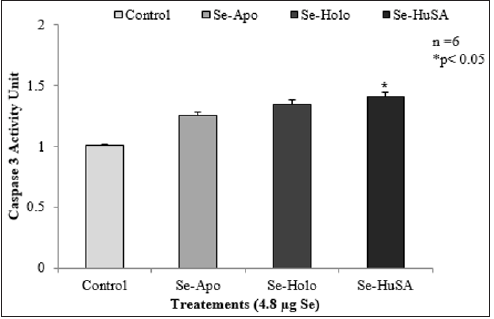
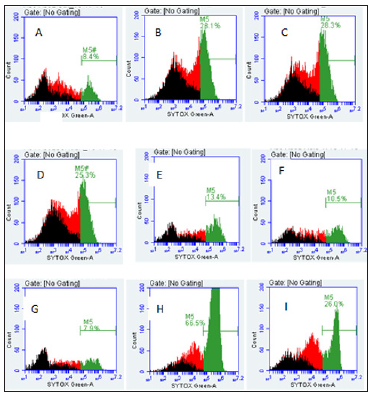
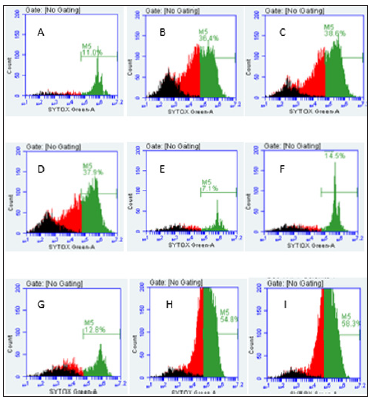
THP-1 cells were also seeded to a concentration of 3 X 10⁶ cells/well and were treated with 4.8 μgSe/well of Se-conjugated Apo-, Holo-Tf, and HuSA for 72 hours (Figure 12). After 72 hours of treatment, Caspase-3 was assayed from control and THP-1 selenium treated cells. Only Se-HuSA showed a statistically significant (p < 0.05) Caspase-3 increase in comparison to the control cells. Se- Apo-Tf and Se-Holo-Tf induced an approximately 0.50 and 0.75 fold increase in Caspase 3 respectively, which was higher but not statistically significant (p > 0.05) from control cells [11,13-18]. For futher cytotoxic assessment of the selenium conjugated proteins,K562 and THP-1 human leukemia cells as treated with Se-Apo-Tf, Se- Holo-Tf, Se-HuSA at a Se concentration of 9.6 μgSe/mg of protein/ well in 24-well plates for 48 hours were assayed by flow cytometry measurements of cell viabilty. After 48 hours of in vitro treatment, all cells were incubated with the fluorescence dyes, SYTOX Green and C12 Resazurin. The Se treated cells were assessed for cell viability by flow cytometry and the results are shown in Figure 13 (K562 cells) and Figure 14 (THP-1 cells). SYTOX green labels and detemines dead cells, C12 Resazurin red labels and determines live cells, and black represents injured cells. The data in the Figures 13 & 14 histograms are presented as a percentage of dead cells among the total number of cells (10,000) counted.
Note: A. K562 control cells (8.4%), B. Se-Apo-Tf (28.1%), C. Se-Holo-Tf (28.3%), D. Se-HuSA (25.3%), E. Native Apo-Tf (13.4%), F. Native Holo- Tf (10.5%), G. Native HuSA (7.9%), H. Selenite 10 μgSe (66.5%), and I. Selenite 1 μgSe (26%).
Figure 13: Live and Dead Assay (% Non-Viable Cells) of K562 Cells by Flow Cytometry and Treatment.
Note: A. THP-1 control cells (11%), B. Se-Apo-Tf (36.4%), C. Se-Holo-Tf (38.6%), D. Se-HuSA (37.9%), E. Native Apo-Tf (7.1%), F. Native Holo-Tf (14.5%), G. Native HuSA (12.8%), H. Selenite 10 μg Se (54.8%), and I. Selenite 1 μg Se (58.3%).
Figure 14:Live and Dead Assay (% Non-Viable Cells) of THP-1 Cells by Flow Cytometry and Treatment.
Leukemia, literally white blood, a cancer of the white blood cells first described by Physician John Hughes Bennett in 1845 whereby immature cells populate bone marrow, lymphoid tissues, and blood [19]. The disease was initially first treated with “Fowler’s Solution” whose main component is arsenic trioxide, a practice continued until the advent in the 20th century of radiation treatment. Radiation treatment for leukemia soon gave way to “chemotherapy” when radiation treatment was found to cause “new” cancers. The use of aminopterin and later methotrexate, both analogs of folic acid, by Pathologist Sidney Farber in Boston, MA, to treat children’s leukemia initially led the way to dramatic remissions of their cancers. For many children remission could last for years but for many others relapse of leukemia would eventually occur and the “miracle” drugs of the follic acid enzyme reduction inhibitors were then found to be ineffective treatments. These first chemotherapeutic drugs were also the first drugs observed to induce in children leukemia drug resistance. Today, drug resistance is an even more common event with the ever newer drugs designed to combat cancer, AIDS, and the emergent of drug resistant bacteria, i.e., methicillin-resistant staphylococcus aureus (MRSA) [20].
The search for new and more effective drugs to treat infectious diseases and cancer continues. Since the discovery of methotrexate to treat children’s leukemia [21], almost 70 different drugs have been approved by the US FDA to treat acute and chronic leukemias. Nevertheless, leukemia resistance in many patient cases continues even with the newest of therapeutic treatments [22].Selenium, like Fe, is an essential dietary nutrient required by all mammalian cells in μg rather than mg quantities [23-24]. Like Fe, Se compounds of specific chemical compositions and at higher than required nutritional concentrations can become toxic [25]. Selenium’s major role in the body is its function in a family of anti-oxidant enzymes, the glutathione peroxidases which were first discovered in 1973 [26]. When not present in these enzymes at higher concentrations, Se as selenides (RSe-) are often singularly catalytic and may initially generate (O2.-) becoming toxic to cells, tissues, embryos, animals, and humans. Many studies of the Se addition to cells in culture and to the diets of animals have shown that varied Se compounds can generate O2.-, are cytotoxic, and induce apoptosis [27-30].
Dietary Fe absorbed from the intestinal tract and then bound by transferrin is internalized by cells via the transferrin receptor. Within the bone marrow and cells, released Fe is incorporated into hemoglobin, cytochromes, catalase, and the other various iron requiring proteins. In 1981 Trowbridge and Omary discovered on leukemia cell membranes, that transferrin receptors are overlyexpressed which lead to the idea of using transferrin to target various drugs to leukemias [2].This present research has combined our ability to attach a covalent redox active selenium-selenide to transferrin and exploit the over-expression of the Tf receptors on leukemia cells. The data presented collectively demonstrates the cytotoxicity of the selenium protein conjugates, but not native proteins, against K562 and THP-1 leukemia cells in vitro. The use of transferrins targeting drugs to cancers has been previously used by other researchers [9,12,31-33]. What is presented here that is new is the use of covalent redox selenium attached to transferrins to target and induce leukemia cell arrest. As quantified by all employed test measures; photographic microscopy, Trypan Blue absorption, MTT assays, and flow cytometry assays; Se-transferrins are cytotoxic to both K562 and THP-1 leukemia cells in vitro in a dose and time dependent manner
Selenite, also known to be toxic to cells in vitro, was added to cells at concentrations of 1 and 10 μgSe/well whose intended use was as a non-toxic (1 μgSe/well) and toxic (10 μgSe/well) positive control in which to compare against the toxicity of the Se conjugated proteins (Figures 4-9). As we expected from previous research [34- 36], 10 μgSe well as selenite was toxic to both cell lines in culture whereas 1 μgSe per well as selenite was not toxic. Additionally, HuSA was conjugated in like manner to the transferrins and was originally thought to be a representative Se-conjugated control protein. To our surprise, Se-HuSA was almost as cytotoxic to the K562 and THP-1 leukemia cells as the Se-transferrins. A postresult review of the literature on HuSA revealed that HuSA is also internalized by cancer cells as a source of amino acids for cell growth [37]. Thus, it appears that Se-HuSA was nearly as toxic to the K562 and THP-1 leukemia cells as the Se conjugated transferrins likely due to internalization and induction of oxidative stress by the same covalently attached redox selenium.
The data presented also reveals a difference in the cytotoxicity of the Se-transferrin conjugates towards the K562 and THP-1 leukemia cells, as well a difference in the selenite selenium cytotoxic susceptibility towards the two leukemia cell lines. As determined by the calculated IC50 Se concentrations (Table 1) the K562 cells were somewhat less susceptible to the Se-conjugate treatments than the THP-1 leukemia cell line by a factor of almost two. Additionally, as calculated, the IC50 of Se-Apo-Transferrin appeared and proved to be more toxic to cells than Se-Holo-Transferrin or Se-HuSA (Figures 3 & 4). There are many references which from the published literature generally concludes that selenium toxicity towards cells is apoptopically induced and the basis for the induction of apoptosis is likely complex [38-39]. However, selenium compounds that are experimentally toxic to cells and animals are mostly all catalytic and redox cycle, initially generating superoxide from the oxidation of thiols. The Caspase-3 assay performed in our experiments with the Se-conjugated proteins all show increases in Caspase-3 being present in cells undergoing Se-conjugate treatments in comparison to controls.
Table 1: IC50 values of K562 and THP-1 Cell Lines Treated with SeApo-Transferrin, SeHolo-Transferrin, and Selenium Human Serum Albumin after 96 hours of Treatment.

Thus, the experimental conclusions we draw is that all of the Se-conjugated proteins are likely internalized via the transferrin receptors and are inducing cell death via a Caspase-3 mediated or partial Caspase-3 mediated pathway within cells under selenide induced oxidative stress. In doing these experiments we have followed time honored methodologies including the attachment of redox selenium to proteins following the original Bolton-Hunter chemistry. The Bolton-Hunter reagent was initially developed in the 1970’s by William Hunter for doing radioimmunoassays as developed for replacement of the more oxidizing chloramine-T reaction for radio-iodinating proteins [40]. This chemistry is well known to acylate lysine residues without significant alteration of the affinity of monoclonal antibodies for performing radioimmunoassay and continues today as a commercially available reagent. We have assumed from the literature in doing these experiments that the cytotoxicity of all the Se-conjugated proteins fully arises from their exclusive endocytosis; albeit a remaining and fully unanswered question.
In summary; human transferrins and human serum albumin were acylated with redox selenium from a newly synthesized modified Bolton-Hunter reagent, the covalently labeled selenium content of proteins having been quantified by ICP-MS. Two leukemia cells lines, K562 and THP-1, both known to over-express the transferrin receptor, were exposed to various concentrations of native and Se-conjugated proteins as well as selenite in cell culture. The Se-conjugated proteins as well as selenite (10 μgSe/well) all arrested cell growth of both leukemia cells lines at beginning concentrations of less than of ~4 μgSe/well. The K562 and THP- 1 cell arrest by the Se-conjugated proteins was at least partially apoptotic in a selenium dose and time dependent manner most likely due to dose dependent oxidative stress. This application of redox selenium conjugation demonstrated herein can be adapted to many other cancer drug targeting molecules as has been recently done by Genentech/Roche with Trastuzumab Ematansine and even more recently by our laboratory with Selenotrastuzumab and Selenobevacizumab.
Prevalence of Bovine Trypanosomosis and Apparent Density of Tsetse Fly in Botor Tolay District, Jimma Zone, Ethiopia-https://biomedres01.blogspot.com/2020/12/prevalence-of-bovine-trypanosomosis-and.html
More BJSTR Articles : https://biomedres01.blogspot.com

No comments:
Post a Comment
Note: Only a member of this blog may post a comment.