Osmotic Adjustment in Roots and Leaves of two Cotton Cultivars with Different Tolerance to Soil Salinity
High salt concentrations in soil water impose osmotic and /or ionic stress and result in changed morphological and development patterns and modified physiological and biochemical processes in plants. Salt stress can inhibit plant growth through numerous mechanisms, including low external water potential, ion toxicity and interference with nutrient uptake, particularly K+ [1]. Both excess and low salinity levels are a concern; The growth of many salt-sensitive plant species is inhibited by low salinity and excess salt in the soil can reduce osmotic potential to such an extent that crops cannot take up enough water [2]. Thus, finding strategies to address salt stress is a global matter that can ensure agricultural success and sustainable food production. Although the plants display marked differences in their salt tolerance degree, they share a similar salt inclusion strategy to deal with excessive salinity [3]. In this process, the leaf tissues are adapted to accumulate large amounts of saline ions, sometimes greater than those surrounding roots.
Such adaptive mechanism is crucial to generate a water potential gradient along root-shoot in order to maintain water flux throughout plant [4]. Most salt stress in plants is caused by Na salts (particularly NaCl) and take two distinct forms: water stress and ionic stress [5]. Salt stress refers to the inhibition of water absorption that occurs when roots uptake high concentrations of Na+ and Cl- . Once these ions accumulate in the plant, they can negatively influence nutrient uptake through competitive interaction with other ions or by affecting membrane selectivity. For example, high Na+ concentrations frequently induce Ca2+ and K+ deficiencies, resulting in impaired metabolic processes and lowered photosynthetic efficiency [6,7]. The adaptation to salinity is accompanied by accumulation of organic osmotically active compounds called osmolytes as a result of alterations in intermediary and secondary metabolism of nitrogen or of carbon. This phenomenon, known as Osmotic Adjustment (OA), is an important component of salinity tolerance mechanisms in plants [8,9]. According to Blum et al. OA is usually defined as a decrease in cell sap osmotic potential resulting from a net increase in intracellular solutes rather than from a loss of cell water.
This salinity tolerance mechanism activates in response to decreased water potential in the root medium; a net accumulation of organic and/or inorganic solutes decrease osmotic potential [10], which in turn pulls water into the cell and allows the plant to maintain turgor [11,12]. More specifically, OA may operate through the accretion of solutes such as electrolytes (e.g. Ca2+, Cl- , K+ , Ca2+, K+ ), proline, free amino acids, sugars, polyphenols, and glycine betaine [13,14]. Through their influence on osmotic balance, these solutes exert a protective effect on major plant enzymes when electrolyte concentrations are high in the cytoplasm [15]. Although there is considerable interest in plant physiological responses to salinity, most of the research examining this topic subjected plants to uniform conditions, with only one concentration of NaCl. However, saline soils are inherently patchy; a field could contain areas ranging from low salinity to several times more saline than seawater [16]. Thus, we currently have limited understanding of plant physiological responses to heterogeneous soil salinity. We require insights into how shoot ion concentrations are regulated by the saline portions of heterogeneous root zones. Cotton (Gosspium hirsutum L.) is a suitable crop for investigating such questions. One of the most economically important crops in China, cotton is classified as salt-tolerant, but this tolerance is limited, varying across cultivar and developmental stage [17]. Several studies have assessed the effect of salt stress on cotton germination, vegetative growth, or yield under uniform salinity [18,19], but not under heterogeneous salinity. Therefore, our aims were first to evaluate the influence of heterogeneous salinity on plant growth, osmotic potential, and Osmotic Adjustment. Next, we compared the Osmotic Adjustment of salt-sensitive versus salt-tolerant cotton cultivars, via measuring solute concentrations and distributions. Our results will complement existing knowledge of cotton physiology under uniform salinity and improve our understanding of how field soil conditions affect cotton growth.
Materials and methods
Experimental Design
The field experiments were conducted using two cotton cultivars that differed significantly in salt tolerance. Salt-tolerant ‘CCRI-79’ and salt-sensitive ‘Simian 3’ were grown in Dafeng Basic Seed Farm located in Dafeng (33°20′N, 120°46′E), Jiangsu during 2013 and 2014. This farm is state-owned, and no specific permissions were required to use this farm for the experiments described herein. Additionally, the field studies did not involve any protected species. We selected three soils that were similar in texture and nutrient composition, but differed in salinity (low, medium, or high). Soil conductivities were 1.15 (low soil salinity, LS), 6.00 (medium soil salinity, MS), and 11.46 dS m-1 (high soil salinity, HS). The LS and MS soils had been planted with rice for the previous 5 and 2 years, respectively, in contrast to the HS soil, which was not planted with rice or cotton before the experiment.
Cotton seeds were directly sown in the field at a density of 45,000 hm-2 on 28 Apr. 2013 and 4 May 2014. Three replicates were assigned randomly for each salinity treatment. Nitrogen (N)- fertilizer (240 kg N ha-1) was sequentially added to the field; 40% as the base and 60% during flowering and boll formation. The amount of P used as base fertilizer was 120 kg P2O5 ha-1. The amount of K-fertilizer was 120 kg K2O ha-1, at a ratio of 50% base fertilizer to 50% during flowering and boll formation. Conventional weed and insect control measures were applied as needed.
Measurement of Plant Dry Weight
The cotton plants were cut at the soil surface and separated into leaves, stems and roots during flowering and boll-forming stages. The root samples were washed with tap water on a 0.5- mm mesh screen. Fresh weight of all plant parts was immediately determined upon sampling. Dry Weight (DW) was measured after drying for 48 h at 70oC. The remaining material from roots, leaves, and stems were collected and immediately frozen in liquid nitrogen, then lyophilized to determine inorganic and organic solute concentrations.
Measurement of Solute Contributions to Osmotic Adjustment
Root and leaf blade samples stored in plastic bags at -20°C were thawed, pressed in a hydraulic press, and centrifuged at 2,500 g for 20 min. The supernatant was used as ‘cellular sap’. The osmotic potential (ψs) in the combined supernatants of three replicates was determined with a vapour pressure osmometer (model 5500; Wescor, Logan, UT, USA). Tissue organic and inorganic solute concentrations were converted to osmolality based on tissue water content. Contributions of leaf and root ψs for each measured solute concentration were calculated according to the Van ’t Hoff equation (Nobel, 1991), which applies strictly to ideal dilute solutions: ψs = -nRT, where n = μosmol (g H2O)-1, R = 8.314×10⁻⁵ m-3 bar mol-1 K-1 and T = 298.2K. For n, the values were expressed as μmol mL-1.
Determination of Organic Solutes
Free proline content was analysed using previously published methods [20]. Total Free Amino Acid (FAA) content was estimated as described by Mukherjee and Choudhuri [21] with some modifications. Fresh root samples conserved in liquid N were extracted with 10 mL of 6% trichloroacetic acid. Four millilitres of each extract was mixed with 2 mL of 2% dinitrophenylhydrazine, then with one drop of 10% thiourea prepared in 70% aqueous ethanol. The resulting reaction mixture was refluxed for 15 min using a water bath and then immersed into an ice bath until cooled to around 0°C. Next, 5 mL of 80% (v/v) H2 SO4 was added. The absorbance was recorded at 530 nm and FAA concentrations were calculated from a standard curve, plotted with known leucine concentrations.
Total Soluble Sugars (TSS) were extracted from 50 mg of lyophilized powder using a previously described method [22]. The extractions were then analysed using an Agilent Hewlett-Packard 5890 series II gas chromatograph (Agilent Technologies, Santa Clara, CA, USA), equipped with a flame ionization detection system and an HP-5MS capillary column. Injector temperature was set to 250°C. The temperature of the capillary column was programmed to increase from 180°C to 300°C at a rate of 5°C per min. We identified individual carbohydrates using relative retention times (i.e. comparing the retention times of the standard with the carbohydrates identified earlier using gas chromatography-mass spectrometry).
Determination of Inorganic Solutes
The concentrations of Ca, Mg, K and Na were analysed in subsamples of finely ground (with a mill grinder) dried plant materials. Approximately 0.5 g of the ground plant samples were placed into digesting tubes, to which 10 mL of concentrated nitric acid and 3 mL of perchlorate acid were added. All samples were soaked for 12 h and then burned at 300°C for 3 h. The residue was transferred to a 50-mL volumetric flask, which was filled with distilled water. The cation content was then measured using an atomic absorption spectrophotometer (TAS-986; Persee, Beijing, China) [23]. To determine Cl- content, leaf samples (0.1 g) were extracted in 10 mL of distilled water via heating at 80°C for 3 h [24]. The Cl- content in the extracts was analysed with ion chromatography (DX-300; Sunnyvale, CA, USA) [25].
Statistical Analysis
The experimental design was completely randomized, including two cotton cultivars and three salinity levels. OriginPro 9.0 was used for data processing and figures. An ANOVA was performed using SPSS version 17.0, and the means were separated with the Least Significant Difference (LSD) test. Differences were considered significant at P < 0.05. In all figures, data are represented as means ± standard errors.
Results
Plant Growth
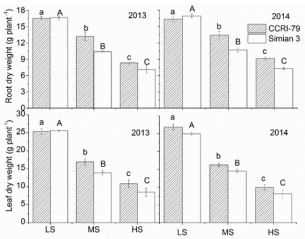
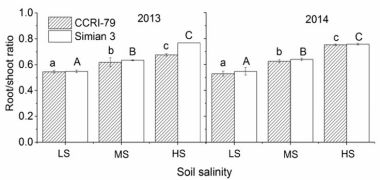
At boll forming and opening stages, the root and leaf biomass (DW) of both ‘CCRI-79’ and ‘Simian 3’ significantly decreased compared with the control (Figure 1). The highest leaf and root DW occurred in LS. Soil salinity inhibited leaf growth more than root growth, and the proportion of root DW to leaf DW increased with increasing soil salinity (Figure 2). ‘CCRI-79’ experienced less growth inhibition under saline conditions than ‘Simian 3’. Importantly, all plants appeared healthy at boll forming and opening stages. Despite their small size in HS, all plants were able to flower (data not shown).
Figure 1: Effects of soil salinity on leaf and root dry weights of two cotton cultivars at flowering and boll-forming stages, during 2013 and 2014. LS: low soil salinity; MS: medium soil salinity; HS: high soil salinity. Vertical bars represent ± standard error (n = 3). Bars labelled with different lowercase letters on open-square bars or uppercase letters on closed-square bars represent significant differences (P < 0.05).
Figure 2: Effects of soil salinity on the root/shoot ratio of two cotton cultivars at flowering and boll-forming stages, during 2013 and 2014. LS: low soil salinity; MS: medium soil salinity; HS: high soil salinity. Vertical bars represent ± standard error (n = 3). Bars labelled with different lowercase letters on open-square bars or uppercase letters on closed-square bars represent significant differences (P < 0.05).
Ion Concentrations
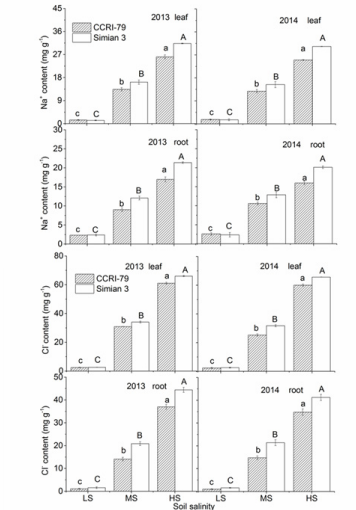
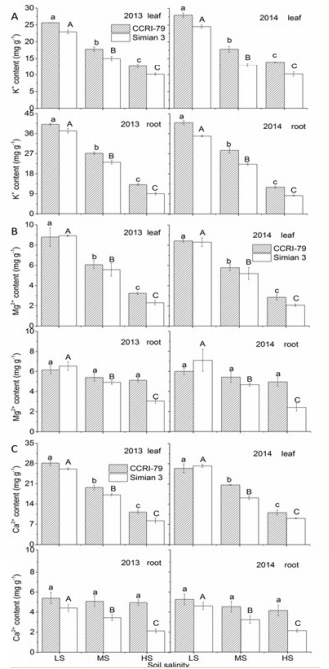
In saline soils, the leaves and roots of both cultivars had higher Na+ and Cl- concentrations due to nonspecific ion uptake and/or membrane leakage. As soil salinity increased, Na+ and Cl- further increased in both root and leaf at the boll forming and opening stages, with ‘Simian 3’ experiencing a greater increase than ‘CCRI79’ (Figure 3). Across all salinity levels, Na+ concentrations in leaves were higher than in the roots of both cultivars, indicating that neither cultivar could prevent Na+ transportation from the roots to leaves. Chlorine ions showed a similar distribution pattern to Na+ . As soil salinity increased, K+ concentrations in the leaves and roots of both cultivars significantly decreased, with ‘Simian 3’ exhibiting significantly lower concentrations than ‘CCRI-79’ (Figure 4A). Magnesium ion concentrations also decreased with increasing soil salinity in both cultivars (Figure 4B), but only in leaves. Root Mg2+ concentrations significantly decreased in ‘Simian 3’ and remained stable in ‘CCRI-79’. In general, regardless of salinity conditions, root Mg2+ concentrations were always lower in ‘Simian 3’ than in ‘CCRI79’. The response of root and leaf Ca2+ concentrations was very similar to Mg2+ (Figure 4C).
Figure 3: Effects of soil salinity on leaf and root Na+ and Cl- concentrations in two cotton cultivars at flowering and bollforming stages, during 2013 and 2014. LS: low soil salinity; MS: medium soil salinity; HS: high soil salinity. Vertical bars represent ± standard error (n = 3). Bars labelled with different lowercase letters on open-square bars or uppercase letters on closed-square bars represent significant differences (P < 0.05).
Figure 4: Effects of soil salinity on leaf and root K+, Ca2+, and Mg2+ concentrations in two cotton cultivars at flowering and boll-forming stages, during 2013 and 2014. LS: low soil salinity; MS: medium soil salinity; HS: high soil salinity. Vertical bars represent ± standard error (n = 3). Bars labelled with different lowercase letters on open-square bars or uppercase letters on closed-square bars represent significant differences (P < 0.05).
Organic Solute Accumulations
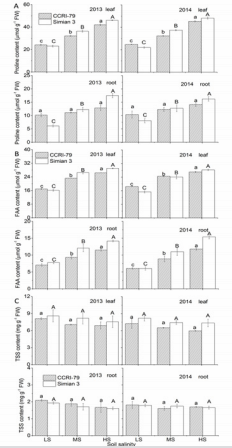
Salinity induced a marked increase in ‘Simian 3’ root proline concentrations, whereas no significant changes were observed in ‘CCRI-79’ (Figure 5A). However, proline concentrations increased with increasing soil salinity in the leaves of both cultivars, although the change was less dramatic in ‘CCRI-79’. With increasing soil salinity, FAA accumulation in roots and leaves increased significantly, being more pronounced for ‘Simian 3’ than for ‘CCRI79’ (Figure 5B). In contrast to FAA, TSS concentrations in the leaves and roots of both cultivars were not significantly changed by soil salinity (Figure 5C).
Figure 5: Effects of soil salinity on leaf and root proline, free amino acid, and total soluble sugar contents in two cotton cultivars at flowering and boll-forming stages, during 2013 and 2014. LS: low soil salinity; MS: medium soil salinity; HS: high soil salinity. Vertical bars represent ± standard error (n = 3). Bars labelled with different lowercase letters on open-square bars or uppercase letters on closed-square bars represent significant differences (P < 0.05).
Osmotic Potential and the Contribution of Individual Solutes to OA
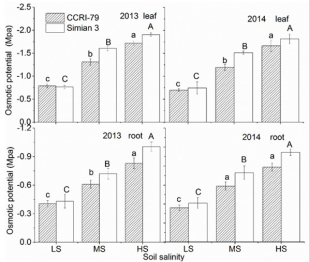
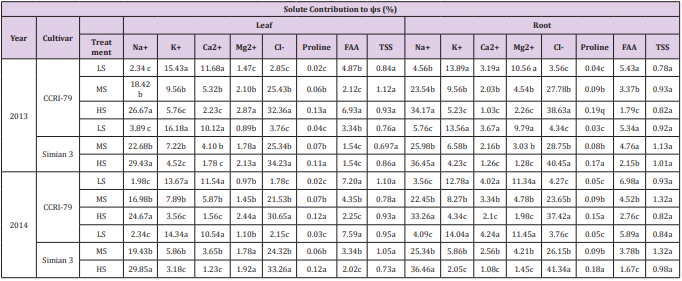
The ψs decreased in leaves and roots of both cultivars with increasing soil salinity. The ψs was approximately two times lower in the leaves than in the roots and was higher in ‘CCRI-79’ than in ‘Simian 3’ (Figure 6). The contributions of organic and inorganic solutes to ψs depended on plant organ and genotype (Table 1). The contribution of Na+ and Cl- in leaf and root ψs increased with increasing soil salinity, especially in ‘Simian 3’. Overall, Na+ and Clcontributions to root ψs were greater than to leaf ψs. Under LS, K+ and Mg2+ were the major contributors to ψs in roots, whereas K+ and Ca2+ were the major contributors to ψs in leaves. With increasing soil salinity, K+ and Ca2+ contributions to leaf and root ψs decreased in both cultivars. However, Mg2+ contributions increased to leaf ψs and decreased to root ψs in both cultivars. Overall, Ca2+ and Mg2+ contributions were much smaller than K+ , which was the primary inorganic solute in the control treatment. As soil salinity increased, however, K+ contribution to leaf ψs in the salt-sensitive and salt-resistant cultivars respectively decreased by about 62.67% and 92.73% during 2013, and by 72.06% and 77.82% during 2014. Additionally, K+ contribution to root ψs in the salt-sensitive and saltresistant cultivars respectively decreased by 62.34% and 68.81% during 2013, and by 66.04% and 85.39% during 2014.
Figure 6: Effects of soil salinity on leaf and root osmotic potential (ψs) of two cotton cultivars at flowering and boll-forming stages, during 2013 and 2014. LS: low soil salinity; MS: medium soil salinity; HS: high soil salinity. Vertical bars represent ± standard error (n = 3). Bars labelled with different lowercase letters on open-square bars or uppercase letters on closed-square bars represent significant differences (P < 0.05).s
Table 1: Solute contribution to the leaf and root osmotic potential (Ψs) in two cotton cultivars grown under differing soil salinity during 2013 and 2014.
The primary organic solute contributing to ψs was FAA. No difference in FAA contribution was observed between the two cultivars. Under LS, FAA contribution to leaf ψs was about 6.50% (in ‘CCRI-79’) and 7.20% (in ‘Simian 3’) during 2013, and 6.93% (in ‘CCRI-79’) and 7.59% (in ‘Simian 3’) during 2014. Under HS, these values decreased to about 2.12% (in ‘CCRI-79’) and 2.25% (in ‘Simian 3’) during 2013, and 1.54% (in ‘CCRI-79’) and 2.02% (in ‘Simian 3’) during 2014. In contrast, proline contributions to leaf and root ψs increased with increasing soil salinity. However, the absolute contribution of proline was the smallest among organic solutes, suggesting that it does not play a large role in cotton OA. In addition, TSS contribution to leaf and root ψs did not change with increasing soil salinity and did not differ across cultivars.
Discussion
Salt Stress Reduces Cotton Biomass
Our results demonstrated that increased soil salinity significantly reduced cotton growth, in agreement with previous research [26]. This negative outcome must be due to the toxic effects of Na+ and Cl- on nutrition uptake. We also observed that leaf growth was inhibited by soil salinity levels more than root growth (Figure 1), again confirming previous results in cotton [27] and other crops [28] showing an increased root/shoot ratio under highly saline conditions. Taken together, the results of this and previous research suggest that increased root/shoot ratio is an adaptation allowing for more efficient water and nutrient uptake under salt stress [29]. Finally, heterogeneous salinity had a weaker influence on root and leaf biomass in the salt-resistant cultivar than in the salt-sensitive cultivar. As will be discussed, we believe the increased tolerance of ‘CCRI-79’ may be caused by differences in the ability of the two cultivars to restrict toxic ion accumulation.
The Role of Inorganic Solutes in Salt Tolerance Mechanisms
In some species, Na+ retention in roots is a convenient saltresistance mechanism, but this does not appear to be the case in cotton. Instead, we found that the salt-tolerant cultivar exhibited lower Na+ concentrations in both roots and leaves than the saltsensitive cultivar. These results can be explained by a lower unidirectional Na+ influx through the roots of the salt-tolerant cultivar, like what has been shown in Thellungiella halophile and likely also decreased Na+ transport to the leaves. In comparison with ‘Simian 3’, ‘CCRI-79’ probably possesses more effective mechanisms to restrict Na+ absorption by roots and transport to leaves, thus minimizing the toxic effects of excess Na+ on physiological processes.
In contrast to the proposed mechanisms of Na+ reduction, the reduction of K+ concentrations in roots and leaves may be due to a down-regulation of the genes involved in K+ transport, as well as to increases in salt-induced plasma membrane damages, which allow K+ to leave the plant and be reabsorbed by the soil. The patterns we observed in K+ concentrations are consistent with the results of Zhong and Lauchli [30] who found that 150 mol m-3 NaCl greatly reduced the deposition rates of K+ in cotton roots. Alternatively, the salt-induced decrease in leaf and root K+ concentrations may be attributed to K+ competition with Na+ on the root plasma membrane, as suggested by Aslam et al. [31]. If true, then the salt-tolerant cotton cultivar in this study may possess a K/Na discrimination mechanism similar to what has been reported for wheat (Gorham, 1994). Calcium ions are widely known to be critical in regulating the passive entry of Na+ and in K+ /Na+ selectivity (Greenway & Munns, 1983), In our study, Ca2+ and Mg2+ concentrations decreased in the leaves of both cultivars, but not in the roots of ‘CCRI-79’.
Thus, the negligible effect of soil salinity on root growth in ‘CCRI79’ may be due to the maintenance of root Ca2+ concentrations, which guarantee membrane integrity and regulate the rate of cellular division in roots. Our findings corroborate a previous study that performed a similar salt-stress experiment on cotton [32]. In our study, the main inorganic ions involved in OA under salt-free conditions were K+ , followed by Ca2+ and Mg2+. However, as soil salinity increased, Na+ and Cl- contributions to OA became predominant. We also observed that the increase in Na+ and Clcontributions to root ψs of salt-stressed plants was higher than to leaf ψs. This pattern is easily explained by research showing that a significant amount of Na+ and Cl- may be retained in the stem and leaf [33], so increases in these organs would not be as dramatic. Furthermore, Na+ and Cl- contributions to ψs were higher in the salt-sensitive cultivar, probably a factor in its stunted growth under salt stress [33].
Thus, our data indicate that in salt-stressed cotton plants, OA is ensured mainly by Na+ and Cl- , particularly in the leaves. This outcome is consistent with recent observations of Na+ and Cl- participation in the OA of salt-treated Atriplex nummularia leaves [34]. Although we also demonstrated that K+ contributed prominently to OA under low-salinity, but not high-salinity, conditions (especially in ‘Simian 3’), we currently know little of the mechanisms underlying its influence on OA in cotton tissue. It is critical to explore the physiological relevance of fluctuations in K+ contribution to OA, as the ion is thought to play a central role in plant salinity tolerance.
The Role of Organic Solutes in Salt Tolerance Mechanisms
Another major player in the OA of salt-stressed cotton was FAA, the main organic solute contributing to ψs. Compared to the inorganic solutes, however, FAA’s role was minor, as indicated by their low overall contribution to OA whether in control or saltstressed conditions. The second most prominent organic-solute contributor to OA was TSS. Like FAA, no difference was observed in TSS contribution to leaf and root ψs under salt stress. Our results contradict reports suggesting that soluble sugars are a major part of full-turgor maintenance in salt-stressed cotton [35], as well as a part of the OA in Crithmum spicatum and C. maritimum [36]. In most plant species (including several glycophytes), proline is considered a non-toxic osmolyte preferentially located in the cytoplasm, or an enzyme protectant [37]. Salinity-induced proline accumulation is well documented, as is the positive correlation between proline content and salt tolerance [38].
However, the role of proline in salt-stressed plants remains vigorously debated [39]. Our experimental evidence showed that proline is not involved in OA of salt-stressed cotton. Importantly, proline contents were higher in the leaves and roots of ‘Simian 3’ than in ‘CCRI-70’. However, we wish to emphasize that under LS, we observed a significant difference in root proline concentrations between the two cotton cultivars, while no significant difference was recorded for ψs. Moreover, the drastic increase of proline content in the roots of ‘Simian 3’ under MS was not accompanied by any increase in ψs. Thus, we suggest that proline is probably associated with separate stress-response functions in plants subjected to excess salinity. Similar results have been reported for other species [39].
Differing Responses of Salt-Sensitive and Salt-Tolerant Cultivars
Leaf and root ψs were always lower in the salt-sensitive cultivar, suggesting that increasing ψs may not be a reliable measure of OA and is unrelated to salt tolerance. In our study, the larger ψs decrease in ‘Simian 3’ was mainly due to higher Na+ and Cl- accumulation. As a result, Na+ and Cl- concentrations may have exceeded the amount needed for OA, negatively affecting development and growth [40-43]. Therefore, we suggest that the mechanism behind salt tolerance in ‘CCRI-79’ is the ability to maintain an OA in the cytoplasm that is suitable for cellular metabolism and plant growth under heterogeneous, salt-stress conditions. Osmotic Adjustment acts to exclude Na+ and Cl- , allowing the plant to physiologically resist salt stress.
Conclusion
The accumulation of Na+ and Cl- was the primary mechanism behind Osmotic Adjustment of root and leaves in two cotton cultivars under heterogeneous salinity, while the contribution of proline, FAA and TSS appeared less important. In addition, compared with the salt-sensitive cultivar, the salt-tolerant cultivar was able to maintain a more suitable osmotic potential in leaves and roots under salt stress, allowing it to make necessary Osmotic Adjustments that facilitate growth in high-salinity conditions. Although more studies are needed to clarify the mechanisms involved in plant adaptive responses to variation in soil salt content, this study provides an integrated approach that demonstrates remarkable contrasts in the OA of cotton roots and leaves under long-term conditions of heterogeneous salinity.
Acknowledgement
This work was supported by the National Natural Science Foundation of China [31301262, 31501343] and the China Postdoctoral Science Foundation [2013M540169].
More BJSTR Articles : https://biomedres01.blogspot.com/

No comments:
Post a Comment
Note: Only a member of this blog may post a comment.