Cropland Water-Soluble Selenium, Groundwater Silicon, Atlantic Rain – Agro-Geological Assessments
Introduction
This study is treating hot water extractable selenium of Finnish
croplands in 1978-80, before the era of Se fertilizers. There are
many methods for cropland Se determination [1], even “total
selenium” can be determined by different selections and orders of
strong acids. Se values are usually expressed by mg/kg, but watersoluble
Se by mg/l or μg/l. Total Se in plough layer has reported
to have been 0.201 mg/kg (N=250) [2], 0.209 mg/kg (N=93) [3],
0.229 mg/kg in 1998 [4]. Generally, Se content has been highest in
clays and organic soils (org), lowest in coarse mineral soils (coms).
In 1979 Se content in coarse mineral soils (coms) (without silt) was
0.157 mg/kg , (calculated) [2] and in fine sandy soils 0.172 mg/kg
(even 1979) [3]; in fine mineral soils [(clay + silt), fims] 0.276 mg/
kg [2] (calculated), in clays 329 mg/kg [2] and 0.290 mg/kg (early
spring) [3]; in mull soils 0.228 mg/kg [2] – in peat soils 0.093 mg/
kg [2] - in organogenic soils 0.464 mg/kg [3]. In studies of Yläranta
in1983 and 13 yrs after start of Se fertilization [4], Se of organic
soils
was about double to that in fine mineral soils and that about 50 %
higher than respective Se in coarse mineral soils. (Coms in Sippola
1979 originally included silt). Se has been associated with clays and
organic matter. Clay fraction consists markedly of micas, e.g., biotite,
relatively high in selenium [5]. Biotite K(Mg,Fe)3(AlSi3O10)(F,OH)2,
contains Si potassium (K) and magnesium (Mg), but no calcium (Ca) [6].
It is weatherable by normal organic acids [7]. Surprisingly
amount of the liberated (molybdate reactive) Si has been only about
1 % relative to the large proportions of cations in the extracts [7].
Colloidal elemental selenium is electrically charged and adsorbed
by clay minerals [5], which explains Se clay association.
Water-soluble Se can be determined by shaking or boiling the
water [8], the exact method is not always clearly expressed, e.g.
“soluble Se” 0.011 mg/l in [2] was extracted by acid ammonium
acetate-EDTA, was not an indicator of water-soluble Se as written
in [4]. Proportion of total Se: water-soluble selenium composed via
hot water extraction, 3-10 % according to (Table 3) (by 7-13μg/kg)
in [1] and 1 % according to text in [1], 2 % (by 6 μg/kg), via water
shaking method without heating according to the study in 13 EU
countries [9], (N = 128) and ca 4 % (by 6-18 μg/kg, in plough layer
of different soil-types) by hot water extraction according to [3] , N
= 230. Proportion of water-soluble Se can vary from 0.3 to 36 %
of total Se, according to several referates in [8]. “Soluble Se” can
indicate [acid (pH 4.65) ammonium acetate-Na2EDTA (AAAc-EDTA)
extractable Se] [9], which was 5 % when Se.H2O was 2 % of total
selenium. “Soluble Se” can even be a synonym for acid ammonium
oxalate extractate, by [(0.18 M(NH4)2(COO)2+0.1 M(COOH)2, pH
3.3)], which was 5-10 x higher to Se.H2O, Table 3 in [1]. In study
of [9] the soil samples were collected from 13 European countries,
samples of [1] from Finland. In the study of [9] plant Se correlated
with soil selenium as follows: Water extr. r = 0.33***, AAAc-EDTA
extr. r = 0.33***, HNO3-HClO4 digest. r = 0.27**, aqua regia digest.
r = 0.23**.
Atmospheric Se: Volatilization of selenium from selenates and
selenites in Finland according to [10] for 3 months has been very
scanty: generally, < 1 %, anyhow from Carex peat Se losses could
reach ca 3 % by treating soils with both lime and organic matter
[10]. Metylated selenium compound can volatilize more easier,
e.g. even 30 % of the selenium added to fine sand in the form of
trimethylselenonium chloride (Se 2,5 mg/kg) volatilized from the
soil during 42 days (the trimethylselenonium ion is an important
urinary metabolite of dietary Se) [11]. Atmosphere is a great
reservoir of Se [12], composed from anthropogenic (62.5 %) and
natural (37.5 %) sources. Vicinity of ocean can increase Se content
in soil [13]. It is expected that the amount of Atlantic rainfall could
effect on atmospheric emission of Se.
Materials and Methods
Groundwater (gw) silicon (Si), calcium (Ca), magnesium (Mg)
and potassium (K) values are provided by Geologic Survey of
Finland [14]. Rural Centes (RC) ‘(04a). Finska Hushållningss.’and
‘(04b).Åland’ are excluded, because of missing Se.H2O values and
‘(16).Ostrobothnia’ because of small number of Si.gw samples and
sulfurous soil [15]. Cropland hot water extractable Se values (Se.
H20), (μg/l) (N.B. weight per volume), in 1978-80 are from [16]
(Soil fertility Service, Eurofins Viljavuuspalvelu Oy). (Method:
dry and milled soil sample was extracted with boiled water at
ratio 1:3. leachate was analyzed using CV-AAS equipment) [17].
Original data, (N=1340), were missing values concerning RC’s
(04a) and (04b). Exclusion of “(16). Ostrobothnia’ caused ca 5 % (N
27) reduction, approximated by its cropland area of Finnish total
value. Whole country mean of [Se.H2O] was 6 μg/l. [Se.H2O] values
by humus content were as follows: 0-3 %: 5 μg/l, 3-12 %, 6 μg/l,
12-20%: 7 μg/l, by peat 4 μg/l (remarkable is that values are per
volume). Geographic coordinates of the Rural Centers are attained
by web search: ‘name of the visually selected central commune’ and
‘geographic coordinates’ or “geographic coordinates dateandtime.
info”. In RC. (07) Renko has been after 1980 combined with
Hämeenlinna, but data for both are accessible, why the old value
was benefited. The order of Rural Centers is the same as by Eurofins
Viljavuuspalvelu Oy. By order we must be careful with RC’s (06),
(07), (12) and (13) – it is not always the same!
Relative regional proportion of Altantic rain, determined by
change in 18O/16O isotope ratio to respective Oceanic standard
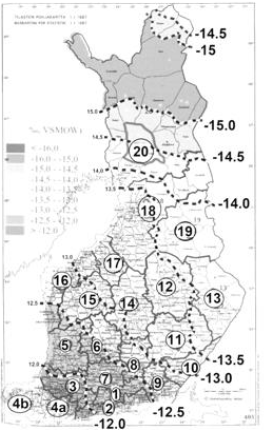
(VSMOW), δ18O (‰), has been estimated by combining the RC map
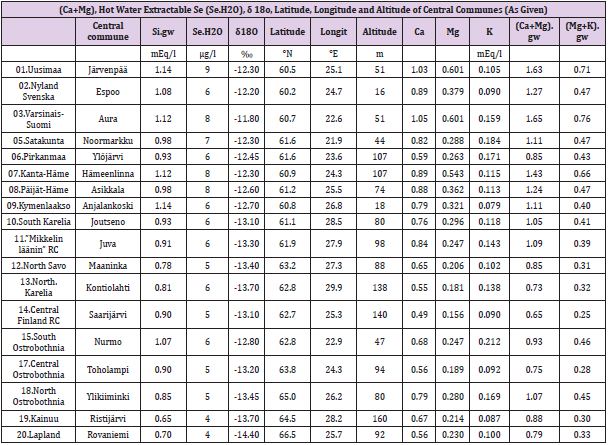
(in [14]) and map in [18] Figure 1. Data for this study is in Table1.
Table 1: Names of Rural Centers after exclusion, names of central communes, groundwater Si, Ca, Mg, K, (Ca+Mg).
Figure 1: Represents regional δ18O values by Rural Centers. Numbers of RC’s are as given in [14], but RC.(04) is divided into two parts with different mineral element database (to clarify other articles).
Results
Comments on Table 2
Table 2: Regressions of groundwater Si,[ Se.H2O] and δ18O by Latitude, Longitude, Altitude and groundwater.
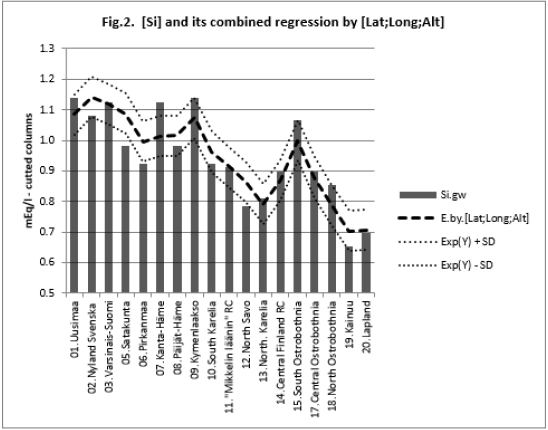
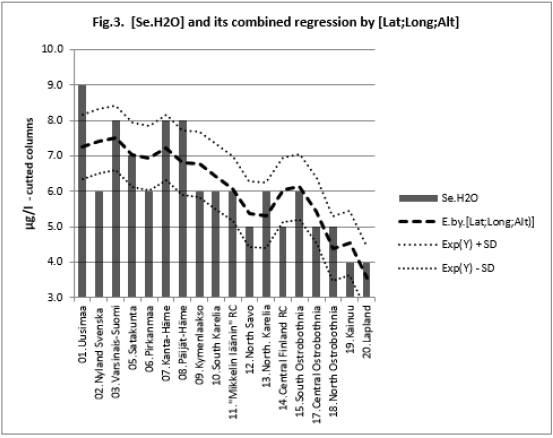
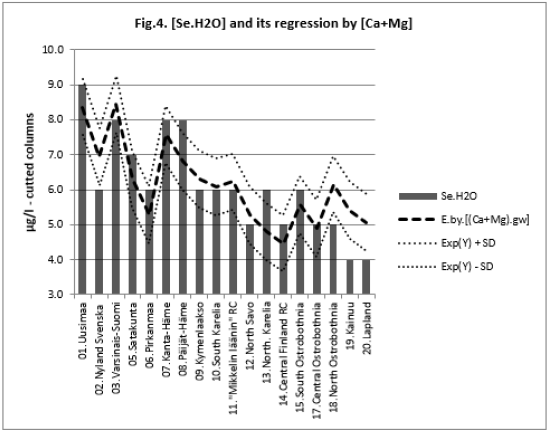
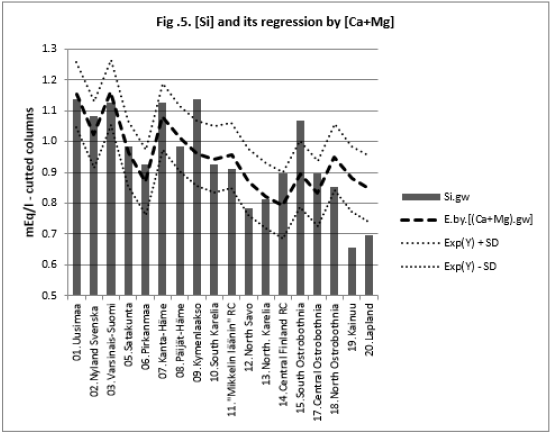
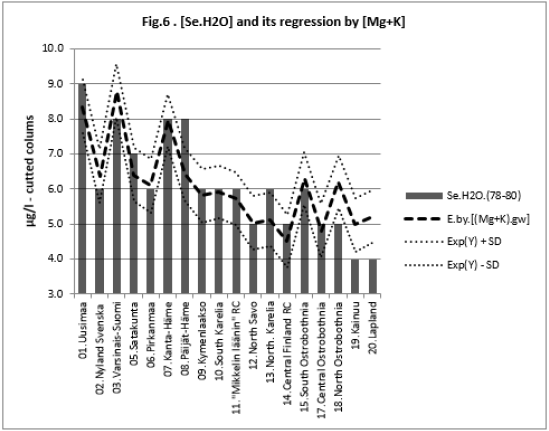
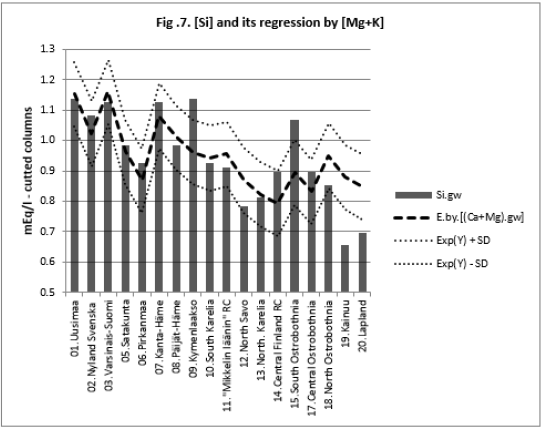
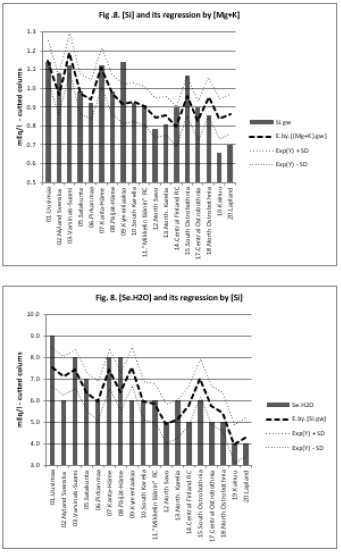
All associations of [Si] and [δ18O] were significant. Long and Alt explained [Se.H2O] weakly: by 14.5 % (ns) and respectively by 17.3 % (p < 0.05)]. Combined regression by [Lat;Long;Alt] explained better [Si] (by 84 %), Figure 2, than [Se.H2O] (by 65.2 %) Figure 3. [δ18O] behaved rather similarly. [Ca+Mg] and [Mg+K] explained stronger [Se.H2O], (by 68.9 %, Figure 4, and 72.2 %, Figure 6, respectively, p < 0.001) than [Si], (by 52.1 %, Figure 5, and 53.9 %, Figure 7, respectively, p < 0.01). [Se.H2O] was explained 62.7 % by [δ18O] and 61.9 % by [Si] Figure 8, respectively (p < 0.001).
Discussion
Remarkable are the high/remarkable associations with geographic factors, especially by [Alt], which has been determined by one point of central commune, which is only a part of each Rural Center. Weathering of rocks in mountains produces sediments that are transported downstream by erosion to create fertile soil in lower parts of the landscape [19]. [Lat], [Long] and [Alt] can be seen as erosion factors: Latitude is associated with temperature (Finnish range of latitude is from 60 to 70 °N). Longitude in general indicates distance to Baltic Sea and soil age [20]. [Alt] means more loss than receiving of minerals via erosion. Combined regression by [Lat;Long;Alt] explained [Si] 84.0 % (p < 0.001), [Se.H2O] 65.4 (p < 0.001) and [δ18O] 95.2 % (p < 0.001). Single associations by these “erosion/dilution factors” were negative, but in combined regressions coefficients of [Alt] were positive by [Se.H2] and by [δ18O], which could suggest, that the losses by erosion could have been partially compensated.
[Se.H2O] was strongly explained by [Mg+K] (72.8 %, p < 0.001),
more strongly than [Si] (53.9 %, p < 0.01). [Se.H2O] association
can be understood by its association with biotite and clay [5,6].
It even suggests that [Si] has other important sources besides
biotite, too. [Si] explained [Se.H2O] by 61.9 % (p < 0.001). This
can be understood by [Se.H2O] -humus [16] and humus-[Si]
[21] associations. Associations of [Se.H2O] are surprisingly high,
range of values is from 4 to 9 (μg/l), and values are integers. [Se.
H2O] sample collection, with regional analyses, [16] from period
before Se fertilization is worthy of attention. When the results (by
Rural Centers) were composed to provincial [Se.H2O] values (not
presented here), they explained stronger timothy Se in [2]. than
“soluble” (AAAc-EDTA extractable) Se in [2]. Remarkable is the
increasing trend in the hot water extractable [Se.H2O] values: 6 μg/l
[16] in 1978-80, 7.3 μg/l in 1982-84 [22] before Se fertilization, 7.8
μg/l in 1985-89 (during Se supplementation) [22], (based on data
of Soil fertility Service as [16], with sampling time usually autumn
[23]), 10 μg/l in 1998 [24] (in early summer, when “timothy had
formed a full spike”, ca one month after Se supplementation) and 9
μg/l in 2006 (estimated mean by author from [1], where Se content
in sand was 7 μg/kg and in clay 13 μg/kg (by rough volume weight
estimate 1 by [4], ca 10-12 months after Se fertilization). Data in
[16], as well as in [22] are results of commercial analyses.
There are several studies on Se content in soil and plants. But
the number of samples has been generally small. “Soluble Se” can
be understood at least in three ways:
a) water-extractable,
b) AAAc-EDTA extractable and
c) acid ammonium oxalate extractable
Additionally, water extraction can be performed by shaking
or boiling Sampling time-point could affect on results during Se
fertilization: e.g. 1 or 12 months after fertilization [24,1]. Label
“solube Se” is non-precise and misleading, e.g., in [4]. N of samples
in [16] (1340) is higher than in [2] (250), which obviously made the
values less sensitive on environmental factors, why it associated
better with timothy Se [2] (can be calculated). (Environmental
factors are not assessed in this article, because specific data on
environmental factors concerning [Se.H2O] is difficult to find).
Availability of Se from fertilizers to plants disappears rapidly
after fertilization [25], why [Se.H2O] increase between 1980
-2006 suggests on change in active Se reservoir [16,1]. High [Se.
H2O] variation in the 1980’s [22] could be explained by sampling
and moderately low Se in early summer in 1998 additionally by
environmental factors. Possibly rapid turnover of [Se.H2O] could
partially explain why increase in [Se.H2O] is lower than in plant
Se. Anyhow 50 % increase in “plant-available” [Se.H2O] [16,24]
could not predict the possible 30-500-fold increase in plant Se [25]
caused by fertilizers.
In Finland there are no satisfactory studies on regional airborne
Se depositions. In 1990 Finnish total “anthropogenic” Se fallout
from precipitation was approximatedly 18.4 t/a (0.54 g/ha) [26].
Se content in rain was 118 ng/l, and in snow 63.1 ng/l, suggesting
on moderate inaccuracy, because consumption of coal and oil was
obviously higher during snowing than raining [26]. Support on
(some part of) Atlantic Se fallout from precipitation gives Danish
rain water (250 ng Se/l) in 1971 [26]. Se association with sulfur
is known [26]. So higher sulfur emissions in 1978-80 to 1991 [27]
together with inaccuracy in Se determination [26] could suggest
on availability of airborne upto Se 1 g/ha/a in 1978-80, cf. 12 g/
ha/a via fertilizers in 1992-2004 [4]. The separate role of airborne
Atlantic Se, possibly upto 1/3 of Se fallout [12], could not be
determined. Anyhow all atmospheric Se via (common) southwest
wind could have had compensated the Se losses – better than by
Si - of the hills, which are impoverishing by erosion Table 2. Low
content of molybdate-reactive silicon (1 %) in biotite extracts by
oxalate [7] can be dependent on aluminium-silicon interactions
[29] in acid solution (pH 0.65).
Conclusions
During the time before Se supplementation “plant available Se”, [Se.H2O], obviously worked well. Humus is the home of soil biota, amount of “plant available Se” can be increased 10-15-fold by mycorrhizae [28], which explains the high association between humus and [Se.H2O]. Conclusions: [Si.gw] was more strongly than [Se.H2O] associated with geographic factors, but [Se.H2O] with clay-indicator [Mg+K], as well as with [Ca+Mg]. Positive coefficient of [Se.H2O] with [Alt] in combined regression by [Lat;Long;Alt] suggests “hint-like” that the altitude-erosion of Se could have been compensated by atmospheric Se. High association between [Si] and [Se.H2O] can be explained by their associations with humus. Se fertilization seemed to have influence on [Se.H2O] and its ability to predict plant Se.
For more
Articles on : https://biomedres01.blogspot.com/


No comments:
Post a Comment
Note: Only a member of this blog may post a comment.