Review of Temperature Measurement Techniques
Introduction
Phase change phenomenon involves instantaneous variations of the local heat transfer, which is coupled to the unsteady fluid currents overlying the surface. An example is the sessile drop, which is of interest in several fields including coating, combustion, and cooling facilities. Understanding of these mechanisms requires fine spatial and temporal measurements, which is essential for applications associated with design optimization and safety consideration of a process. Such consideration is crucial within the operations of boilers, for instance, where the evolved heat flux is restricted by the boiling crisis. This operational regime is often associated with equipment failure. Within the miniaturized electronics applications such as transistors, high heat fluxes up to 200 W/cm2 can be liberated from such instruments, where a low wall superheat is desired with respect to the cooling fluid. Thus, operating within the correct boiling regime becomes paramount in the thermal management of the operating equipment [1-4]. In addition, some of the proposed models are not well validated due to the limited resolution of the available data, which might bring about a misinterpretation of the phase change phenomenon under study. Such situations can be encountered with respect to models based on point measurements, which cannot resolve fine spatial resolutions associated with phase change phenomenon [5-6]. In the current paper, some of the relevant temperature measurement techniques are provided, which include point measurement techniques and IR thermography. A review of fluorescing materials and their usage within temperature measurement applications are given by the end of the paper.
Point Measurements
A conventional point measurement technique is the thermocouple, which operates on the basis of Seebeck effect. In principle, two dissimilar metals are connected at a junction, which generates a small voltage with respect to a given temperature. Such technique was used to acquire average heat flux measurement over a surface of interest [6]. In parallel to this technique, Truong [7] considered using a heat fluxmeter, so as to evaluate the heat transfer coefficient associated with a heat sink, via Newton’s law of cooling. The drawback of such methods is that its usage is limited to quasi-steady state regime, which cannot be used for complex flow phenomena, due to multidimensionality and the instantaneous local changes of the fluid-wall interaction [6-7]. In case of the heat fluxmeter, significant measurement error can incur, in case the thermal properties of the instrument was not well quantified [7].
Resistive Based Sensors
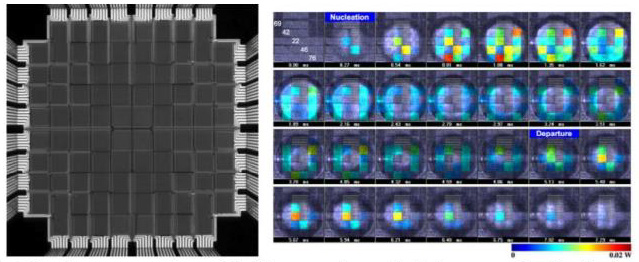
In the past decades, thermal resistance-based sensors has been the focus of wide of variety of applications. These include thermal actuator, flow rate and temperature measuring devices, and sensors pertaining to gas monitoring within food logistics [8-10]. Several studies focused on developing high compact microheater sensors, with competitive spatial resolution performance. Such advances were permitted with development of microfabrication, which enable one to realize fine features as small as a submicron length. Such sensors can play a crucial role in detailed examination of adverse flow condition, as in phase change application for instance, which can be achieved by its instantaneous measurement at multipoint resolution and its conformity to nonplanar surfaces [11-14]. Among the various works on resistive sensors, is the one done by Guereca [15] in the field of microelectromechanical systems, which was used in boiling application. The instrument used in Guereca [15] study was fabricated via ion beam milling and photolithography, which had a dual function of providing heat to surrounding fluid and for temperature measurement purposes. The latter used to measure the nucleation temperature, based on sudden changes in the observed temperature, with respect to the temperature coefficient of the instrument resistance [15]. Figure 1 depicts the microheater array used by Demiray and Kim [16] within FC-72 pool boiling experiment.
Figure 1: Micro heater array for pool boiling experiment (left), heat transfer distribution under nucleating bubble at micro heater surface (right) [16].
Some of the major challenges with respect to the sensor’s fabrication regard the dimensional scale difference between the patterned lead connection and the deposited sensor metal, which is one of the main causes for electrical disconnection, due to the sensor’s breakage along the lead’s edges. Such issues are further complicated if an adhesion layer exist between the flexible substrate and the pattern leads. In addition, it is crucial to include a thermal insulation within the metal sensor design, which can affect its performance criteria, such as measurement sensitivity and resolution [11-12,17-19]. Also, some studies have indicated deviation of the material properties from bulk metal value for thicknesses close to the mean free path. For instance, Siegel, et al. [20] observed an inverse relation between resistance and temperature for gold thickness of several nm, as opposed to the proportional correlation between resistance and temperature for bulkier gold thicknesses. Inhomogeneity in the deposited sensor can lead to large temperature gradient on the sensor’s surface, which can affect the integrity of the temperature measurement. For instance, Guereca [15] noticed that the acquired temperature measurement was lower for thinner fabricated resistive sensor. Lastly and not least, such temperature measurement requires direct contact with fluid of interest, and it has an element of Joule’s heating. Thus, there is some form of intrusion upon the investigated phenomenon, which might induce some form of error.
Non-Contact Local Temperature Measurement Techniques
A breakthrough in surface temperature measurement has been achieved recently, via infrared (IR) technology, which permitted local heat flux measurements at fine spatial resolution. Such technique proved to be of an essence in proper understanding of heat transfer mechanism, and to further elaborate existing models and correlations.
Infrared Thermography
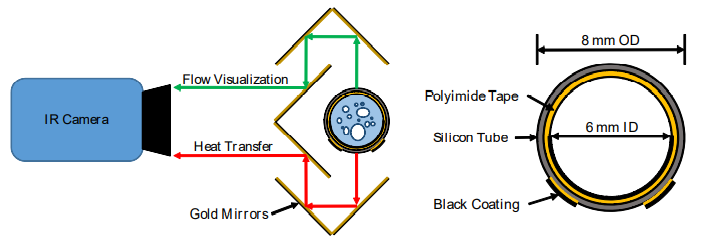
Several studies utilized Infrared (IR) technique in order to resolve the local wall heat transfer in both pool and flow boiling applications. An example is the study conducted by Scammell and Kim [21], where they examined the effect of vortex shedding upon the local wall heat transfer in flow boiling applications. A schematic of the flow boiling test section is shown in Figure 2. The IR measurements in such studies are based on black coating of the wall surface, adjacent to the working fluid, which acted as temperature markers for the IR camera. The temperature profile across the wall was deduced numerically, in a coupled radiationconduction problem from which the local heat flux profile was resolved [21].
Figure 2: Flow boiling test section setup featuring golden mirrors for simultaneous heat transfer measurements and flow visualization (left image), and cross-sectional view of the flow boiling test section (right image) [21].
Some of the major obstacles associated with IR thermography, pertains to the availability of the IR optical properties, which is required to resolve the temperatures across IR transparent materials, such as silicon and Kapton tape [6,22-24]. Not to mention that IR transparent materials are not easy to machine, such as in the case of CaF2 [25]. In addition, in case there is a sharp temperature gradient, there is a restriction on the minimal number of pixels covering an area, so as to resolve the spatial temperature distribution at a region of interest [22-23]. Jason [23] has also raised an issue pertaining to the integration time with respect to the calibration range, where an error in the order of 10 degrees can incur, in case the measurement was done outside the calibration range.
Time Domain Thermoreflectance
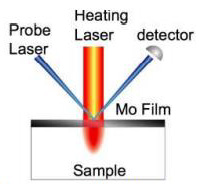
Another non-contact measurement technique is the time domain thermoreflectance (TDTR), which relies on the examining the material reflectance property variation with temperature. A schematic of the TDTR technique is shown in Figure 3. Such approach is applied in order to determine the thermal properties of materials, which is of interest within the development of new materials, including nanomaterials and thin films. In a study by Mehrvand and Putnam [24], the heat transfer coefficient at the thermal boundary layer within a flowing fluid was examined using TDTR technique. One of the advantages of the TDTR techniques is its spatial resolution relative to IR thermography, due to its use of visible light. On the other hand, TDTR requires a complex setup, which involves various optical equipment and probing instrumentations. Therefore, its generally not applicable to the complex geometries that can arise in boiling heat transfer application.
Figure 3: TDTR setup for material thermo conductivity measurement (ww.nist.gov/programs-projects/measurements- and-standards-thermoelectric-materilas).
Fluorescing Measurement Techniques
The following subsections summarizes the measurement techniques that utilizes photoluminescent materials, such as liquid crystals and quantum dot. Such measurement approach relies on the spectral emission variation of such materials temperature, which can give a fine spatial resolution of the surface measurement.
Liquid Crystals
Thermographic techniques based on liquid crystals and fluorophores has been suggested as a temperature indicator. One such an attempt is the work done by Kenning [26], where he examined the wall temperature profile within nucleate boiling application, via a thermochromic liquid crystal. However, such techniques can involve tedious calibration procedures and limitations associated with equipment availability and operating costs [27-30]. Not to mention, the narrow temperature operating range by liquid crystal technique [25].
Quantum Dots
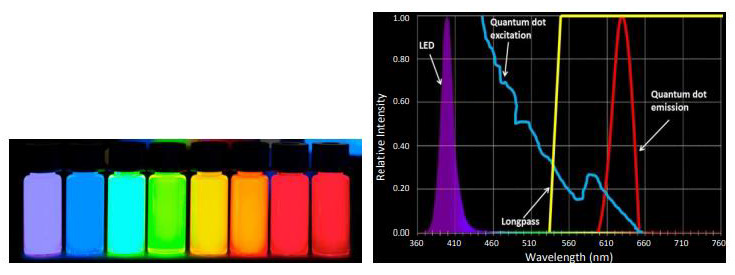
Quantum dots (QDs) are semiconductors whose length scale is in the order of nanometers and thus subject to 3D confinement. QDs have unique optical properties relative to traditional fluorophores in which it can be excited by a wide range of wavelengths. In addition, it emits light over a narrow spectrum at a longer wavelength, which can easily be captured using a long pass filter. Solid-state lamps in the form of LEDs are usually used for QD excitation purposes. As a direct consequence of the QD length scale, the color of the emitted light can be tuned by changing the QD size via temperature and synthesis time control of the fabrication process. Examples of QDs spectrum emission variation is shown in Figure 4. QDs are prepared in a colloidal liquid, and it can easily be transferred to surfaces of interest via spray or spin coating. Such versatile fabrication processes can greatly downsize the expenses, pertaining to facility complexity [31-38]. Other QDs delivery methods include electrostatic coating, UV curable solutions, as well as sol-gel approach [38-42]. According to the airy diffraction theory, the minimum spatial resolution that can be detected by a camera (x) is related to the observed wavelength (λ) by Equation 1. In Equation 1, f is the distance between the lens and object and d is diameter of the aperture. Thus, QD has a spatial resolution advantage over IR thermography, where local heat flux measurements can be acquired at submicron ranges, due to its smaller wavelength emission [43].
xf =1.22λd (1)
Figure 4: QD, (left) emission from dots of increasing size from left to right (Wikipedia.org/wiki/quantum_dot).(right)Spectral characterization of QD.
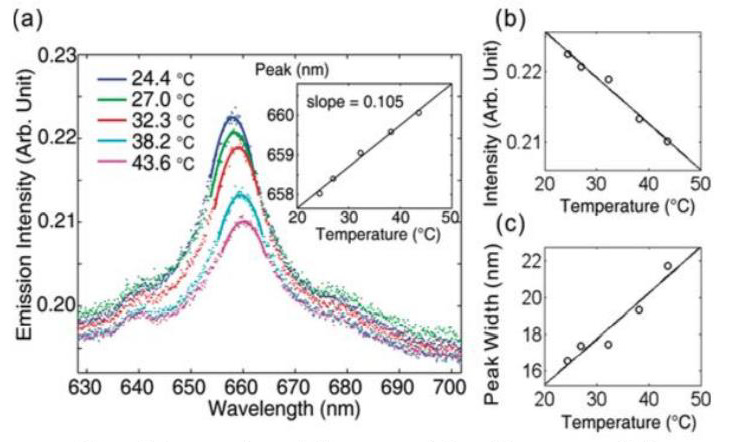
Another characteristic of QDs is the temperature dependency of their optical properties as shown in Figure 5, which can be exploited for temperature measurement purposes. This can be related to stoke shift behavior of QDs, which is related to the photoluminescence peak shift, as was observed in previous studies [33,37,44-46]. The temperature variation alters the QD optical properties due to thermal expansion of the QD structural lattice [30,36]. Two trends are evident. The intensity of the emitted light tends to decrease with temperature and the peak in the emitted spectrum tends to shift to longer wavelengths. The changes in the intensity and peak wavelength spectra are not necessarily proportional with temperature. The emitted light intensity changes with temperature tend to be quadratic, which makes it less precise than spectral measurement over large temperature ranges [37,45].
Relative Intensity
1.00
0.80
0.60
0.40
0.20
0.00
360 410 460 510 560 610 660 710 760
Wavelength (nm)
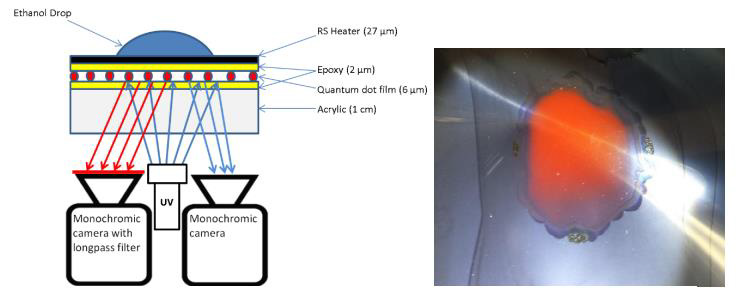
Several studies have used QDs to measure temperature. Al Hashimi and Kim [47] investigated the local heat flux distribution arising from the vaporization of an ethanol drop, where QDs dispersed within a gelatin film were used to acquire surface temperature variation underlying the ethanol drop. The experimental setup for the ethanol drops temperature measurement is given in Figure 6. Matsuda, et al. [31] used ZnSAgInS 2 QDs for surface temperature measurement due to their low toxicity and high temperature sensitivity. Jorge, et al. [33] achieved independency from the excitation source intensity by using multiple QDs with different emission spectra and looking at the intensity ratio. Sakaue, et al. [34] developed a QD temperature sensor for cryogenic application. Li, et al. [44] examined the temperature profile of a micro-heater by calibrating the spectral shift of QDs with temperature. They emphasized the importance of QDs particle concentration on a surface so as to achieve a certain temperature precision as a result of particle size variation [44].
The average temperature precision was enhanced at a higher number of QD particles, according to Li et al. [44]. Wang et al. [39] developed a miniaturized temperature sensor in the form of a reflective fiber for high temperature applications. In a similar line of work to Wang et al. [39], Bueno et al. [37] developed a photonic planar waveguide temperature sensor using nanocomposites of CdTe and CdSe, which were embedded in PMMA. QDs-PMMA nanocomposites have a peak spectral emission at a shorter wavelength than colloidal solutions of QDs, due to the particles agglomeration and waveguide effects introduced by PMMA matrix. In addition, PMMA tends to be hydrophobic, which minimizes the effect of humidity upon temperature measurement [37]. One of the issues pertaining to QDs can be related to the photobleaching degradation of the emission, which is associated with the breakdown of QDs as a result of continuous light excitation. Other issues pertain to the temperature calibration, which is sensitive to the observed noise in the QD emission readings. Such issues can be remediated by utilizing a high quantum yield of QDs, or photoluminescence emission, and by utilizing CCD cameras instead of CMOS cameras for higher signal to noise ratio [33-34,48-49]. Yu, et al. [45] reported an initial blue shift of the QDs peak spectral emission to shorter wavelengths during the first heating and cooling cycles. Such behavior was resolved by exposing the QDs to several thermal cycles, which resulted in a reproducible spectral peak emission with respect to temperature. Other issues pertain to photooxidation, which can cause an irreversible blue shift due to interaction with surrounding gases [48]. Also, the concentration variation of QDs on a particular area can bring about an uneven intensity distribution, since it’s difficult to control the uniformity of QDs over a surface [38,44].
Temperature Sensitive Paint
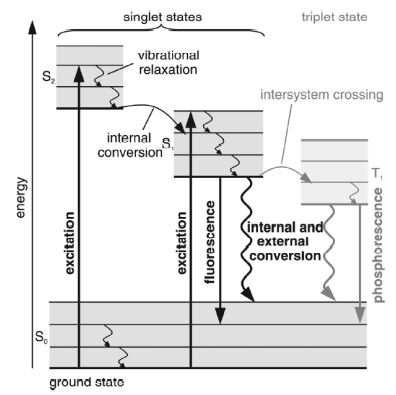
Another fluorescing material that works under the same principle as the quantum dots is the temperature sensitive paint (TSP), which comprises of a light emitting luminophores and a binder. As shown in Figure 7, the luminophores gets excited to a higher energy state upon absorption of photons from a short wavelength light source. Afterwards, the excited luminophores undergoes a decay to a lower energy state, where it emits light at a longer wavelength. This process is called photoluminescence. Two conversion processes compete with the photoluminescence of the TSP, which causes the luminophores to decay closer to its ground state: first, the external conversion of the luminophores energy, which is associated with its emitted light quenching via molecular interaction. Such process is relevant within pressure sensitive paint applications, where various oxygen concentrations are associated with different light emission intensity from the luminophores. The second type of the luminophores conversion processes is the internal conversion, which is associated with the energy state variation of luminophore with temperature. Such process is called thermal quenching [25]. The material selection for the luminophores and the binder governs the optical characteristics of the yielded TSP. For instance, the temperature dependency of the luminophore’s light emission varies from one material to another. In addition, the operation of the paint as a temperature sensitive or pressure sensitive paint depends on the binder permeability to oxygen [50]. Recent interest in TSP has emerged in several applications, as a local temperature measurement mean.
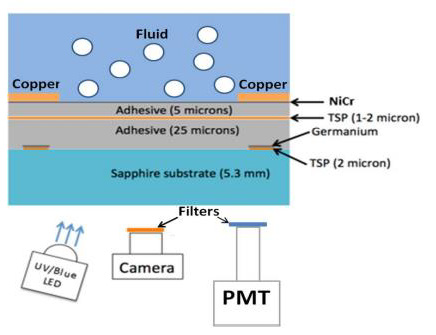
One of those attempts is the work by Al Hashimi, et al. [51], where Ruthenium based TSP was used to measure the local heat flux distribution within both pool boiling and flow boiling application. Figures 8 & 9 illustrate the test section set up within the pool boiling experiment, where the local heat flux distribution was acquired using the inverse heat conduction problem. The temperature measurement across the adhesive layer was used as boundary conductions for the heat conduction problem, where the heat evolved to the boiling fluid was evaluated as the difference between the heat generated at the NiCr heater and the heat lost to the Sapphire substrate. In Shibuya, et al. [52] study, local temperature variation was captured in form of TSP intensity changes, as a consequence of a passing bubble. Several studies utilized TSP optical properties for surface temperature measurement within wind tunnel facilities some of which were involved in hypersonic flow conditions.
Among the various wind tunnel experiments are the work by Kurits [53], Bhandari [54], Lee, et al. [50], Schramm, et al. [55], Huang [56], Yang, et al. [57] and Ozawa et al. [58], where the local temperature distributions were deduced from surface of interest, based on the observed TSP emission. In more recent study by Liu and Risius [59], TSP is used for thermal imaging purposes within high-enthalpy shock tunnel application. Within Liu and Risius study, a reliable heat flux sensor was used in conjunction with an in-situ calibration technique, so as to determine the thermal penetration within the TSP layer, via an analytical inverse solution [59]. Long [60] utilized multiple luminophores one of which is temperature insensitive, so as to account for the intensity variation within the excitation light source. In a study by Huang, et al. [61] examined the temperature profile within a microchannel flow application, via the optical properties of the TSP. Simultaneous flow visualization and thermal profiling was achieved by Matsuda, et al. [62] for a multiphase flow phenomenon, within microchannel applications. In Matsuda study, TSP was used to survey the temperature profile at various flow boiling conditions, where the acquired Nusselt number was in good agreement with the Sieder- Tate equation [62]. Other work by Ishii and Fumoto [63] utilized TSP in order to acquire temperature distribution at the evaporator wall of a pulsating heat pipe. From the temperature data analysis, a correlation was acquired between the temperature distribution and the observed oscillatory flow phenomenon within the pipe. In addition, a temperature accuracy of 0.263°C was reported within Ishii and Fumoto study [63].
Recent interest in luminophores utilization was found in other applications, such as its usage as PSP. Examples are the studies carried out by Jiao, et al. [64,66,67]. In Jiao, et al. [64] study, a twodimensional correction factor was adopted in the data analysis, so as to resolve the temperature sensitivity of the PSP. Such result was validated against CFD data. In another study by Noda, et al. [66], PSP was used to resolve the transient pressure field on a NACA 0012 airfoil. Other applications for PSP include jet impingement, such as the study carried out by Li, et al. [67], where it was used to examine the pressure field characteristics near the impingement point, such as the nozzle-plate distance, impingement angle, and pressure ratio. The luminophores suffer from similar shortcomings as the quantum dots. For instance, paint thickness inhomogeneities over the surface as well as non-uniform excitation light illumination are among several factors attributed to the observed noise within optical measurements. Background noise and particulates can also interfere with the optical properties of the TSP, which can bring about a shift in the observed intensities. Photobleaching effect tends to be more severe in the case of TSP [68]. In a recent study by Liu et al [69], the temperature dependency of the thermal diffusivity parameter was addressed within the TSP heat flux measurement, which can arise within hypersonic wind tunnel applications. A correction factor was developed within Liu et al study, which was validated against simulation data [69]. Other issues pertaining to the error arising from the TSP apparent temperature relative to the actual wall temperature, as was suggested in a study by Liu, et al. [70]. Such discrepancy becomes more prominent as the thickness of the TSP layer increases, relative to adjacent layers [70].
Conclusion
In the current review paper, various temperature measurement techniques were examined, along with their applications in various research works. Conventional temperature measurement techniques include thermocouple and microheater arrays, where thermocouples can misrepresent the local interaction at the measurement surface, due to its spatial limitation by its average measurement approach. On the other hand, microheaters are complex to fabricate and are difficult to install on non-flat geometries, such as tubes. In the past decade, IR thermography was adaptedas a measurement technique, which can monitor the temperature distribution at a micron resolution. Therefore, an enhanced measurement fidelity can be achieved with respect to the investigated phenomenon. Some of the drawbacks of the IR technique is its compatibility with the measurement surface, which can be opaque to the IR wavelength or are generally expensive to acquire. Novel temperature measurement approaches involve fluorescing materials, which act as a potential alternative to IR thermography. Such materials include QDs and TSP, which operate within the visible wavelength. Hence, a broader range of materials can be used as a substrate for the experiment, where an affordable monochromic camera can be used for local temperature measurement purposes in various applications, such as pool boiling.


No comments:
Post a Comment
Note: Only a member of this blog may post a comment.