A New Method of Muscle Strength Testing Using a Quantitative Ultrasonic Technique and a Convolutional Neural Network in Healthy Adults and Patients
Introduction
Muscle strength testing is extensively applied for rehabilitation assessment of neurological diseases and osteoarticular diseases. The testing result can provide bases for the development of rehabilitation plans and assessment of rehabilitation training effects. The most commonly used methods currently include manual muscle strength testing, isometric muscle strength testing (such as dynamometer and tensiometer use), isotonic muscle strength testing (such as dumbbell and sandbag tests), isokinetic muscle strength evaluation, surface electromyography, and needle electromyography [1]. However, manual muscle strength testing, the most commonly used method in clinical practice, is a semiquantitative method that is limited by inaccurate anatomical positioning. Isometric and isotonic muscle strength testing can only detect a small number of muscles and cannot effectively examine muscles with a muscle strength lower than grade IV. Isokinetic muscle strength evaluation is performed when limb movement is always at a predetermined speed (isokinetic); for example, the knee extension peak torque at an angular velocity of 60˚/s under knee extension selected in this study is the international standard for determining extensor strength. However, due to limitations such as only a small number of detectable muscles, difficulty in examining muscles with a strength lower than grade IV and expensive instrumentation, isokinetic muscle strength evaluation is not well-suited for clinical development. Electromyography is more favorable for muscle strength comparisons in the same patient before and after treatment, but the absolute value has limited significance.
Needle electromyography is invasive and causes substantial pain to patients, while surface electromyography is also limited by inaccurate anatomical positioning [2]. In summary, a clinical evaluation method that can address the above deficiencies and comprehensively assess muscle strength must be developed. Ultrasonic imaging is a real-time, non-invasive, non-radioactive, convenient, and cost-effective testing method with accurate anatomical positioning and extensive applications. In 1968(Ikai and Fukunaga 1968), the application of ultrasonic imaging methods confirmed the conclusion that, regardless of differences in age and training, the strength produced by a cross-sectional area per unit of muscle is almost the same [3]. Many subsequent studies confirmed that when the cross-sectional area of a muscle is larger, the muscle strength is greater. With increasing age or some neuromuscular diseases, muscle quality decreases. For example, the muscles of old people or patients with amyotrophic lateral sclerosis (ALS) (Arts et al. [4]). Marfan syndrome (Voermans, et al. [5]), or Ehlers–Danlos syndrome (Voermans, et al. [6]) are infiltrated by adipose or fibrous tissues; therefore, the cross-sectional areas of muscles cannot accurately reflect the number of muscle fibers, but the average echo intensity will increase.
Directly displaying whether a muscle is recruited under ultrasonic imaging is difficult. However, many studies have shown that substances such as adenosine and adenosine monophosphate in capillaries increase after muscle contraction. These substances function on the precapillary sphincter to cause exercise-induced muscle hyperemia. In contrast, unrecruited muscles do not contract and their blood vessels will not dilate [7]. Power Doppler ultrasonography can reveal the number of red blood cells passing per unit area and the signal amplitude and is sensitive to changes in blood vessel diameters in muscles. (Dori, et al. [8]) showed that red blood cell signals in muscles displayed by power Doppler ultrasonography significantly increased after rapid repetitive muscle contractions and reached the plateau stage after 40-60 s; however, increased signals were not observed in the muscles of muscular dystrophy patients. Therefore, power Doppler ultrasonography has excellent application prospects for displaying blood flow changes after muscle contractions to determine the level of muscle recruitment. Manual extraction of quantitative ultrasonic data is time-consuming and labor-intensive, hindering direct application of ultrasonography in clinical practice. Artificial intelligence (AI) is an active research topic and has been widely applied in various fields.
We aim to use intelligent software to automatically process quantitative ultrasonic images and establish relationships between the resultant data and muscle strength testing [9]. Deep learning usually requires the deep neural network algorithm, which includes the structures of the deep network, convolutional network, sequence network, and recurrent network. A convolutional neural network is a neural network specifically used to process data with a similar network structure, such as time series data (which can be considered a one-dimensional network formed by regular sampling on the time axis) and image data (which can be regarded as a two-dimensional pixel network). Convolutional networks show excellent performance in many fields. A convolutional network refers to a neural network that uses the convolution algorithm to replace the general matrix multiplication algorithm in at least one layer of the network [10]. In summary, in addition to muscle thickness and average echo intensity, this study aimed to use quantitative ultrasonic technology to increase the number of related parameters of power Doppler ultrasonography measured to describe the number, quality, and recruitment level of muscles. In addition, this method was compared with the existing muscle strength testing methods. Image recognition was performed using the traditional multivariate linear regression statistical method and the AI convolutional neural network algorithm to investigate the application of quantitative ultrasonic technology for direct evaluation of muscle strength in clinical practice.
Materials and Method
This study recruited 80 volunteers including 54 healthy volunteers, 24 unilateral quadriceps atrophy patients and 2 bilateral quadriceps atrophy patients. These healthy volunteers met the following inclusion criteria: no major complaints of muscle numbness, spasm, or atrophy, muscle-related physical activity impairment, or joint swelling and pain, no obvious malformation in the lower limbs, no disease history in the musculoskeletal system, nervous system, and peripheral blood, and no history of severe trauma in the lower limbs. In addition, joint mobility and muscle tension met the thresholds of muscle strength assessments. The volunteers did not have severe osteoporosis, were not in any stage of acute inflammation or acute bone fracture repair, and were between 18-55 years of age, with no gender restriction. Simultaneously, the patients catered to the demands of the following inclusion criteria: having quadriceps atrophy caused by long-term immobilization after surgery or peripheral nerve injury, no major complaints of muscle numbness, spasm, or joint swelling and pain, no obvious malformation in the lower limbs. Plus, joint mobility and muscle tension met the thresholds of muscle strength assessments. The volunteers did not have severe osteoporosis, were not in any stage of acute inflammation or acute bone fracture repair, and were between 18-55 years of age, with no gender restriction. We received informed written consent from each person to participate in our study. This study has been reviewed by the ethics committee of Peking University Third Hospital.
As mentioned above, isokinetic muscle strength testing is an internationally recognized quantitative muscle strength testing method. All isokinetic muscle strength testing was performed by the same therapist is this study. The quadriceps muscle strength of the volunteers was measured using the System 4 Biodex multijoint isokinetic system (Biodex, USA). The test used 3 speeds for measurement: slow, medium, and fast. The slow-speed measurement was repeated 5 times. The knee extension peak torque usually occurred in the first 3 measurements and was mainly used to determine the maximum muscle strength. The medium-speed measurement was repeated 10 times, and the fastspeed measurement was repeated 20 times. The total measurement time for the unilateral knee joint was 120 s; this measurement time ensured that full muscle hyperemia was achieved by the 2nd ultrasonic imaging measurement [11]. Collection of all quantitative ultrasonic data was performed by one ultrasound physician. The Aixplorer® series color ultrasonic diagnostic instrument of Supersonic Imagine (Aixplorer, France) and an L15-4 linear array probe were used. The medial head of the quadriceps muscle was measured. The subjects wore short pants that settled above the knees. Tight pants were avoided to prevent impaired venous return, which can affect the power Doppler ultrasonography result. The subjects did not exercise within half an hour before testing. Two-dimensional images of the subjects’ muscles were collected in a quiet resting state and used to measure muscle thickness and the average echo intensity.
The power Doppler images were used to measure the level of muscle hyperemia. The measurements were performed in the 0° knee extension position and the most prominent part of the medial head of the quadriceps muscle was measured by the ultrasound physician using visualization. The probe angle was perpendicular to the trajectory of the muscle bundle, and the measurement was performed with the muscle in a relaxed state. After the measurements, the knee was restrained to complete the isokinetic muscle strength test. When testing of the last group was completed, the knee was released immediately. The two-dimensional image and the power Doppler image at the same location were captured and the image acquisition time was no more than 3 s. The muscle thickness of the medial head of the quadriceps muscle was manually selected and labeled by the ultrasound imaging physician. The average muscle echo intensity was measured using Adobe Photoshop CS3 software. A sector region of the medial head of the quadriceps muscle was delineated using the lasso tool and the average value of the sector region was read using the histogram interface of the software. Because the image was composed of black, white, and gray colors, the average echo intensity was expressed as the gray scale; the minimum value of 0 indicated that the image was mostly “black”, and the maximum value of 255 indicated that the image was mostly “white”.
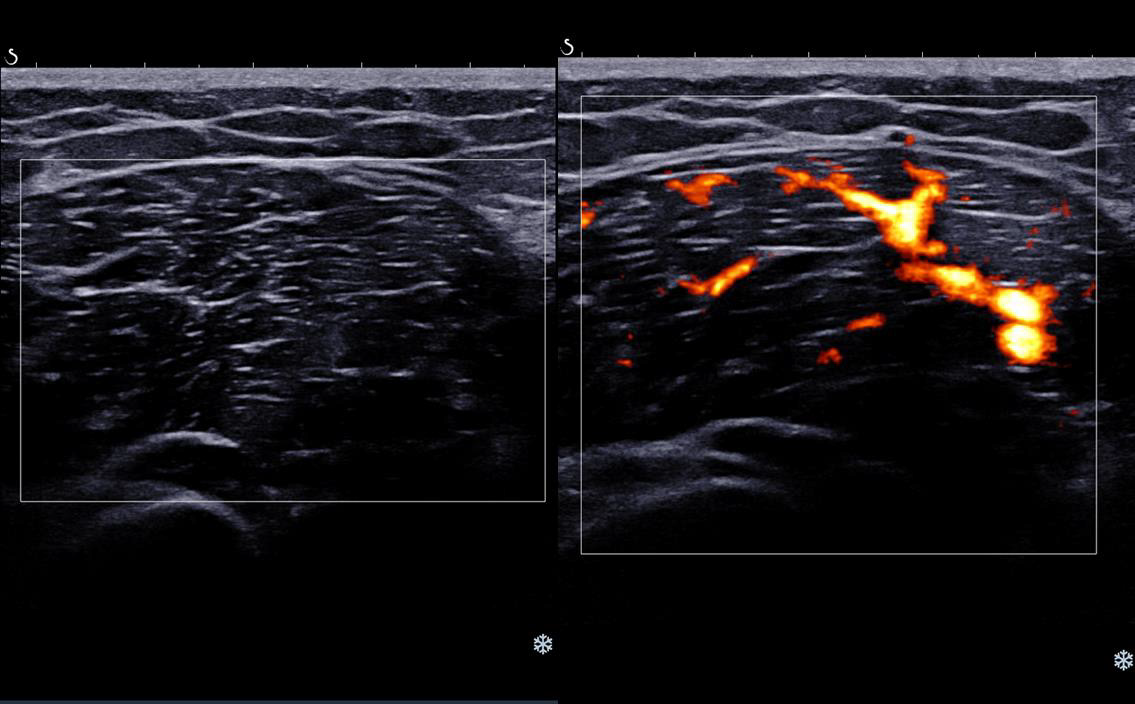
The power Doppler ultrasonic signal regions were different before and after exercise. (Figure 1) shows images of the same subject before (left) and after (right) exercise. The signal region significantly increased, indicating that muscle hyperemia significantly increased. Measurement of the signal regions from power Doppler ultrasonography before and after exercise was performed using Adobe Photoshop CS3 software. The signal regions were delineated. The value of a delineated region was read using the histogram interface of the software and expressed in pixels. Due to the difference in image magnification Z and the signal intensity gain value G, the signal regions of the medial head of the quadriceps muscle on power Doppler ultrasonography before and after exercise required correction using the following formula. The corrected power ultrasonic intensity was determined and expressed in pixels.

Figure 1: Comparison of the signal intensity on power Doppler ultrasonography before and after exercise in the medial head of the quadriceps muscle.
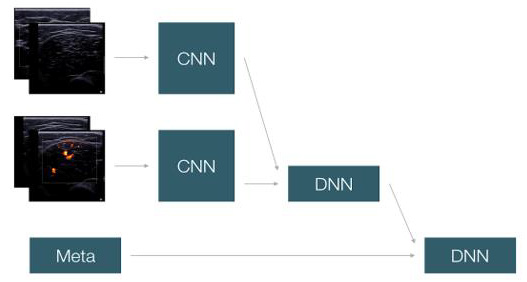
Figure 2: The convolutional neural network model (DNN: Deep Neural Networks. CNN: Convolutional neural network).
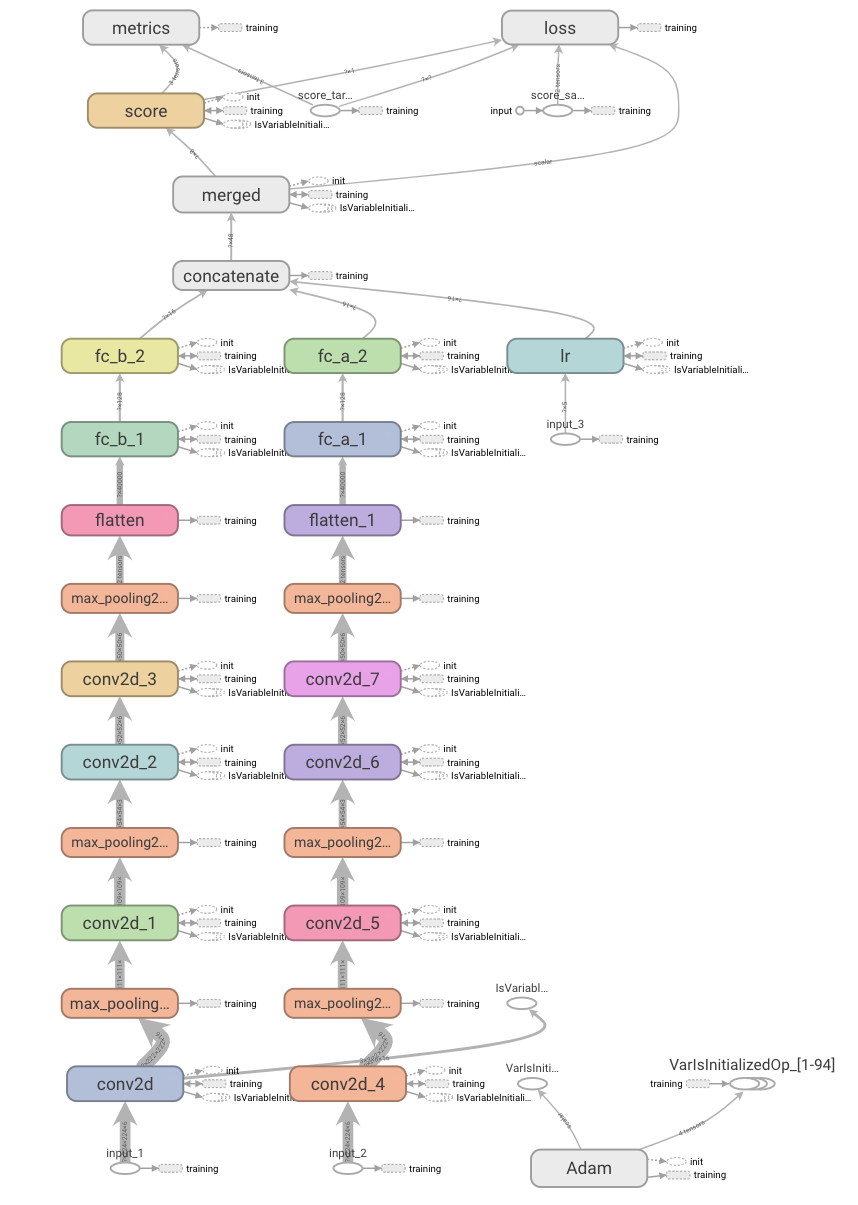
Multivariate linear regression: Multivariate linear regression analyses of the above measurement data were performed using SPSS 19.0 statistical software. Convolutional neural network model: Four known muscle strength images (2 before exercise and 2 after exercise) and participant information (gender, age, height, and body weight) were the inputs, and the knee extension peak torque was the output. A total of 160 groups of data consists of 132 healthy lower limbs and 28 quadriceps atrophy lower limbs from 80 volunteers was used as the training data set in this study, and the convolutional neural network was used for learning (Figure 2). The specific network structure included the use of two channels to extract features from the input data. The first channel extracted image features. The two groups of ultrasonic images before and after exercise were separately connected to one set of the convolution layer, which included 3 sections. The first section contained 1 3x3 16-kernel convolutional layer and 1 2x2 pooling layer. The second section contained 1 3x3 32-kernel convolutional layer and 1 2x2 pooling layer. The third section contained 2 3x3 64-kernel convolutional layers and 1 2x2 pooling layer. Feature extraction in ultrasonic images was performed using this set of convolutional layers to develop image features. The second channel extracted the 0/1 numerical features developed after binary processing of the personal information of the subjects. The numerical features and image features were connected to a neural network hidden layer containing 128 nodes for feature combination. The correlation between feature combination and fitting features was analyzed to obtain a final score, which served as the predicted knee extension peak torque. Algorithm design: The convolutional kernels of the two image convolutional channels were 3*3*16, 3*3*32, and 3*3*64, followed by a 128-neuron hidden layer. In addition, image features and numerical features were merged for feature combination through a 16-neuron hidden layer to obtain the final predicted score (Figure 3).
Results
Forty-five men and 35 women were included among the volunteers. The basic information of the subjects is show. The quantitative ultrasonic technology parameters (muscle thickness, average muscle echo intensity, and corrected power ultrasonic intensity) and muscle strength parameter (knee extension peak torque) were introduced into SPSS 6.0 for data processing via multivariate linear correlation analysis. The dependent variable y, knee extension torque (Nm), was a continuous variable and conformed to a normal distribution. The independent variables were x1, muscle thickness (cm); x2, muscle average echo intensity (gray scale); and x3, corrected power ultrasonic intensity (pixel). The model R value was 0.708>0.4, and the adjusted R^2 was 0.492>0.1, indicating that the fitting degree of this model was relatively ideal, the goodness of fit was comparatively high. In the ANOVA table, the F value of the regression equation was 52.248. The probability of the significance test was 0 and was smaller than the significance level of 0.05. The coefficients were not 0 at the same time and the linear relationship between the explained variables and the overall explanatory variables was significant; therefore, a linear equation could be established. The coefficient table (Table 2) shows that the significance of all independent variables was smaller than 0.05, indicating that these 3 variables all had a significant linear correlation with the dependent variable. Furthermore, x1 and x3 showed positive correlations and x2 showed a negative correlation with the dependent variable, results that were consistent with the hypothesis. VIF values were all smaller than 2, indicating that the collinearity was not strong.
The final equation was obtained from this coefficient table.

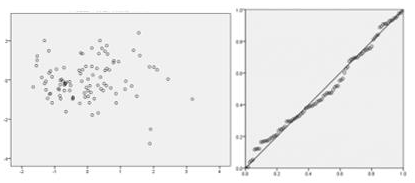
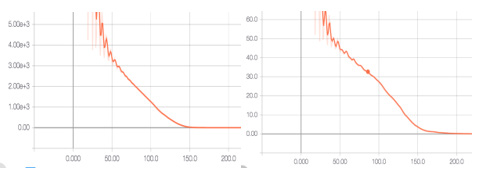
A residual analysis was performed. The P-P plot (Figure 4) showed that the source data and the normal distribution did not have significant differences and the residual met the requirement of a linear model. The scatter plot showed that these 3 points were evenly distributed on upper and lower sides of the vertical coordinate “0”, indicating that the data conformed to the model well. The products of pairwise multiplication among the three independent variables were introduced as interaction terms for multivariate linear regression. The coefficient table was then obtained. Except for x1, the significance was greater than 0.05, indicating no interaction among the independent variables. During the learning process of optimization iteration, MSE was selected as the loss function, and Adam was used as the optimizer algorithm to obtain the optimal value. After 200 rounds of iteration of 160 sets of data, the model results were obtained. After 200 rounds of iteration, the muscle strength accuracy rate was 93% and the range of the muscle strength accuracy was ±0.1 (Nm). By solving the model through the loss function, we hoped to achieve predicted and target values that were as close as possible using this model. After 200 rounds of iteration, the overall difference between the predicted and target values in the validation set was smaller than 0.01, indicating that the personal information and imaging information of the volunteers could be used to fit and approximate the real muscle strength data. The mean squared error (MSE) and mean absolute error (MAE) functions are shown in (Figure 5).
Discussion
The multivariate linear regression results not only confirmed that muscle thickness and average echo intensity correlated with muscle strength but also innovatively validated that the power Doppler ultrasonic parameters also had strong correlations with muscle strength, further supporting the clinical application of quantitative ultrasonic technology as a muscle strength testing method. The neural network algorithm of AI provides a more convenient alternative to manual extraction of ultrasonic data. Only a few seconds are required between the acquisition of basic information and ultrasonic images of subjects and obtaining the predicted torque; therefore, the method of manual labeling and calculations using the corresponding formula are omitted and the application range of ultrasonic imaging in muscle strength assessment is thus increased. The sample size in this study was small; however, a model with excellent accuracy was still obtained. Various errors in the manual extraction of ultrasonic image data highlight the advantages of AI. This model can be incorporated into the ultrasonic imaging instrument as a plug-in function. By inputting the basic information of a patient and examining the twodimensional ultrasound and power Doppler ultrasound images before and after exercise, the predicted knee extension peak torque can be obtained using the convolution neural network model. This method has the following advantages.
The anatomical positioning is accurate, the muscle strength of any muscle can be theoretically determined, patients do not experience trauma and pain, ultrasound is very popular and inexpensive, no consumable supplies are used, and AI deep learning can further increase the accuracy of predicted results. This study not only recruited healthy subjects but analyzed some quadriceps atrophy patients, which makes the methods and conclusions of this study having a better practical value in clinical applications. Regardless of decreased muscle thickness caused by disuse or pathological atrophy, reduced muscle quality caused by muscle disease or aging, or abnormal muscle recruitment caused by upper or lower motor neuron damage, both the linear regression equation and the AI model have significant applicability. The focus of future research may be on a more scientific and effective exercise program and scenarios in which no gold standard of muscle strength assessment exists. We believe that combining quantitative ultrasonic technology and the AI imaging recognition algorithm in muscle strength testing in clinical practice is feasible.
Conclusion
The successful establishment of the regression equation and the AI model in this study provide certain bases for using quantitative ultrasonic technology as a new method for muscle strength testing in clinical practice.
For more Articles on: https://biomedres01.blogspot.com/

No comments:
Post a Comment
Note: Only a member of this blog may post a comment.