Monday, February 6, 2023

Predicting Delays in Acute Ischemic Stroke Care with Machine Learning


Predicting Delays in Acute Ischemic Stroke Care with Machine Learning

Introduction

Machine learning with neural networks have demonstrated remarkable success in finding patterns in structured, as well as unstructured data. It has been applied to various aspects of health care including early detection and diagnosis, treatment, as well as outcome prediction and prognosis evaluation [1]. Process optimization is another application of machine learning, as it can find intricate trends from historical data. With 15-year historical data from the stroke thrombolysis program at a tertiary care center, an attempt was made to design a neural network with the aim of predicting team performance, in terms of door to needle time (defined as the time interval from arrival at the hospital to administration of the thrombolytic drug). Such information could be of help to warn of potential delay when a particular patient arrives, and the team armed with this information will be better enabled to pre-empt the delay [2].

Methods

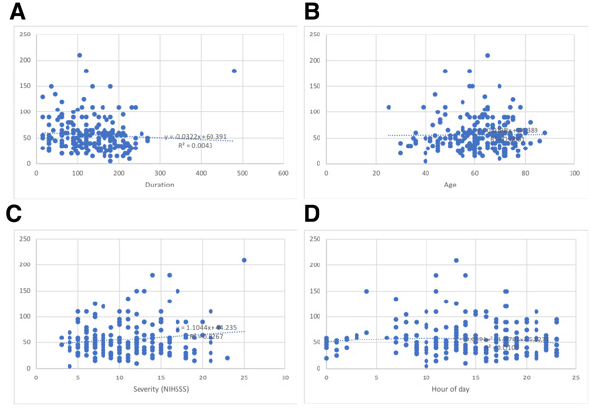
Historical records of acute stroke thrombolysis were available from 2003 – 2018. The data was first split into training, validation sets. Data from 2003 – 201, consisting of 221 cases, was used as the training data, and the last 2 years’ data of 61 cases was used for validation. Identification of feature and target measures. (The inputs parameters fed to a machine learning model are called features, and the output it is trained to optimize on, the target). It has been reported from various centers that the door to needle time in acute ischemic stroke tends to have an inverse relation to duration of stroke at presentation [3], and this was replicated from data in our center as well. Similarly, regression and scatter plots were used to identify that: severity of stroke by NIH Stroke Score (NIHSS) scale, age of the patient in years, time of the day (rounded to the nearest hour) were also showing an association with the door to needle time, though individually the effects were weak (Figure 1). Thus, these four features were selected to train the network. The target parameter was the door to needle time, parametrized as above or below 45 minutes, as this was the cut off that showed the best predictive performance. Cases with delay <= 45 minutes were labelled as 0 and others as [1] (Table 1).

biomedres-openaccess-journal-bjstr

Table 1: Features and target.

Neural Network Architecture

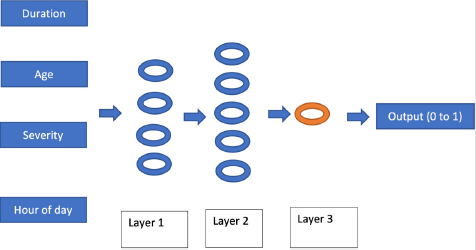
A 3-layered fully connected architecture was used and implemented using the open source Tensor Flow framework [4]. The number of neurons in each layer were 4, 6 and 1, from input to output. The first two layers consisted of rectified linear activation units (Re LU), and the final unit used the sigmoid activation function, to give output in the range of 0 to 1. (Figure 1). The source code of the implementation is available at https://github.com/mlnoone/ nnstroketeamperf/

Training

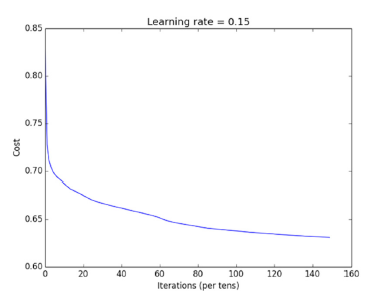
The network was trained using batch gradient descent, with total iterations of 1500. Sigmoid cross entropy cost of the 45 min delay prediction (ranging 0 to 1) vs actual status (0 vs 1) was used as the minimization target. The learning rate was optimized based on performance on the training set and a value of 0.15 achieved the best result as shown in (Figures 2 & 3).

biomedres-openaccess-journal-bjstr

Figure 1: Scatter plots showing the (weak) correlations with door to needle time in minutes (on the vertical axis in all) of duration (A), Age(B), Severity (C) and Hour of day (D)

biomedres-openaccess-journal-bjstr

Figure 2: The neural network architecture.

biomedres-openaccess-journal-bjstr

Figure 3: Plot of cost vs iterations as the network was being trained at a learning rate of 0.15

Hyper Parameter Tuning

Based on performance in the training and the validation sets, the hyper parameters of the network were optimized. Performance on the validation set was assessed using the following parameters:
a) Accuracy, defined as percentage of delay > 45 min correctly predicted.
b) Sensitivity and positive predictive value (also called recall and precision in machine learning parlance) which were combined into the F1 score, defined as: 2 x precision x recall / (precision + recall).
These were then used to select the optimum hyper parameters for the network which, in addition to the learning rate of 0.15, included:
a) The number of neurons in each layer as mentioned above was set at 4, 6 and 1 which resulted in optimum performance on the training set (accuracy 60%, precision 68%, recall 71%, F1 0.68).
b) L2 Regularization was used to minimize overfitting which was observed initially, a regularization parameter (lambda) of 0.02 was chosen based on observing the result over a range of parameters to minimize error on the validation set.

Results

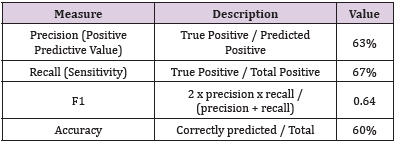
The network after optimization showed precision (positive predictive value) 63%, recall (sensitivity) 67% and F1 0.64 on the validation set, with an overall accuracy of 60% (Table 2).

biomedres-openaccess-journal-bjstr

Table 2: Performance measures on the validation set.

Discussion

Neural networks are capable of extracting intricate patterns from complex data, which are otherwise nearly impossible to delineate. They have been applied with remarkable success in fields like advertising and manufacturing to optimize performance based on structured data. Though the success of neural network with unstructured data like computer vision, speech and language are more widely appreciated, they are also remarkably effective in analyzing structured data. As seen here, with four weakly associated parameters it was possible to develop a reasonable prediction model for stroke team performance with 60% accuracy and 63% positive predictive value. Application of neural network in this context of optimizing acute care based on a predictive model has not so far been reported in literature. With increasing application of care pathways, neural networks could be a natural choice to build predictive models to identify potential for errors and delays.


For more Articles on: https://biomedres01.blogspot.com/


Friday, February 3, 2023

Pneumothorax Associated with Thoracic Endometriosis: Current Knowledge


Pneumothorax Associated with Thoracic Endometriosis: Current Knowledge

Introduction

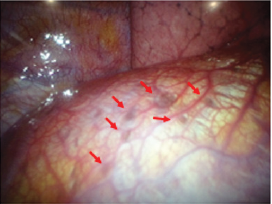
Endometriosis is a condition in which endometrial-like glands and stroma are located outside of the uterine cavity. The ectopic endometrium is encountered most commonly pelvic structures such as ovary, uterine ligaments, pelvic peritoneum, and genital structures [1-4]. The usual site of endometriosis outside of the abdominopelvic cavity is in or around the lung (intrathoracic cavity) (Figure 1). Although endometriosis in general can affect up to 15% of women of reproductive age, thoracic endometriosis remains a very rare condition [5-9]. Thoracic endometriosis produces a broad range of clinical and radiological manifestations, including catamenial pneumothorax (80%), catamenial hemothorax (15%), hemoptysis (5%), and rarely pulmonary nodules [5-9]. The age of onset in patients with thoracic endometriosis (a mean of 35 years) is higher compared to a mean age at presentation of 25 to 30 years in patients with only pelvic endometriosis [5-9]. The exact mechanism of catamenial pneumothorax associated with thoracic endometriosis remains unclear, but several hypotheses have developed to explain this condition.

biomedres-openaccess-journal-bjstr

Figure 1: Endometriosis involving the pleural surface of diaphragm (arrows). The clinical and laboratory findings have been reported previously [32].

Retrograde Menstruation through Diaphragmatic Fenestrations

The endometrial tissue is thought to move through the fallopian tubes to the peritoneal cavity by retrograde menstruation backflow [4]. The endometrial cells in peritoneal fluid may follow clockwise peritoneal circulation and pass through the right paracolic gutter towards the right sub-diaphragmatic region. The phrenicocolic ligament on the left side and falciform ligament form barriers that prevent cells and fluids from reaching the left sub-diaphragmatic area [10,11]. Implantation of endometrial cell leads to the formation of endometriotic nodules on the ventral side of the diaphragm [10]. The nodules cause cyclical necrosis and induce diaphragmatic fragility, leading to the formation of the usual diaphragmatic fenestrations. After endometrial tissue enters the pleural space, it may form colonies in other part of the diaphragm or in the pleural space. Air leaks from vagina may occur during the menstrual cycle when the cervical mucus plug is deleted [10-14]. This hypothesis may be in good agreement with the observation that endometriosis occurs nine times frequently on the right hemidiaphragm than on the left [4,6,14,15].

Coelomic Metaplasia

The second proposes the coelomic metaplasia mechanism that causes endometriosis by metaplasia of mesothelial cells lining the pleura and peritoneal surfaces into endometrial stroma and gland [9,16,17]. Transformation of these cells may be affected by physiological stimuli such as estrogen [18]. Support for this hypothesis is observed in endometriosis patients with Mayer- Rokitansky-Küster-Hauser syndrome who lack a functional endometrium [19,20]. Rare cases of endometriosis can also occur in men receiving high-dose estrogen. The coelomic metaplasia hypothesis provides an explanation for pleural cases of thoracic endometriosis. However, this fails to explain the right-sided predominance seen in patients with thoracic endometriosis.

Prostaglandin

The third is a bioactive substance-mediated mechanism in which high levels of prostaglandins, in particular prostaglandin F2α. Prostaglandins are detectable in the plasma of women during menstruation. Circulating prostaglandins increase with menstruation [21,22-25] and causes vascular and bronchiolar vasoconstriction, leading to the vasospasm and associated ischemia within the lung [23,25,26]. This may result in alveolar rupture of previously formed subpleural blebs and bullae, and subsequent air leaks [23,25-27].

Hematogenous or Lymphatic Metastasis

An interesting hypothesis of metastasis suggests that endometrial transplantation occurs through lymphatic or hematogenous dissemination of endometrial cells, explaining both the thoracic and other sites of implantation, in an analogous manner to cancer metastasis [7,28,29]. Review of autopsy data of humans with thoracic endometriosis shows that patients with bronchopulmonary endometriosis usually have bilateral lesions, whereas diaphragmatic and pleural diseases are predominantly right sides [17]. Perhaps the most compelling evidence for the benign metastasis hypothesis is derived from the investigations of ectopic endometriosis lesions occurring in remote parts of the body including the bone or brain [8,21,30-32].

Comment

Thoracic endometriosis is characterized by the presence of endometrial-like glands and stroma within the lung parenchyma or on the diaphragm and pleural surfaces. It remains unclear how endometrial tissue migrates to the thoracic cavity, but it is often associated with abdominal endometriosis. As none of the theories proposed alone can account for all clinical manifestations of this condition, so the etiology of thoracic endometriosis development is likely multifactorial and closely intertwined with each other hypothesis.


For more Articles on: https://biomedres01.blogspot.com/

Thursday, February 2, 2023

Sexual Satisfaction Among Slovenian Population


Sexual Satisfaction Among Slovenian Population

Introduction

Partnership not only satisfies the basic needs of the individual as a social being, but also contributes to health, positive interpersonal relationships, self-confidence, good self-esteem, and general well-being [1,2]. Sexuality is also crucial for good partnership and an important part of the human life cycle [3-5]. Sexual orientation is a predisposing characteristic of a person who is sexually attracted to persons of the same and/or opposite sex. Sexual orientation refers to the gender to which a person is emotionally, physically, sexually, and romantically attracted. It is primarily assessed through personal evaluation and reporting of whether one is attracted to a man or a woman [6,7]. Engaging in sexual relationships with persons of the same or opposite sex most often determines a person’s sexual orientation. Factors that influence whether a person has sex with a person of the same or opposite sex include availability of a partner, moral relationships, social norms, curiosity, need to fulfill the role of a parent, financial motives, etc. [8].
In sexuality it is necessary to separate the masculine and feminine sides. Men are more pragmatic beings, while women are more tactile beings. Therefore, an embrace is of great importance for a woman’s perception of sexuality, as the release of serotonin, dopamine and oxytocin then increases. A woman, who is otherwise a hyperdynamic being and has all her senses constantly activated, usually closes her eyes when kissing. This activates the depilation of the basic system of the visual sense, with which we reach the maximum information capacity of up to 90% [9]. Therefore, the aim of the study was to assess sexual satisfaction in the general Slovenian population using an adapted but modified questionnaire, which was suitable for identifying differences in sexual satisfaction between different variables.

Methods

The study was conducted on female and male participants via online survey. The online survey began in July 2020 and was completed in September 2020. The research was conducted according to the principles of the Declaration of Helsinki. All participants were informed of the aims and anonymity in writing before the study began. Informed consent was given by clicking the “Proceed with questionnaire” button. The National Ethics Committee approved the study design (No. 0120-200/2020/6).
Recruitment was based on the following inclusion conditions:
(a) Age of 18 years and older, and
(b) Personal consent to the questionnaire.
Participants with mental and sexual disorders were also included in the study. All participants were asked for demographic data: gender, age, marital status, education level, sexual orientation, number of children, number of all lifetime sexual partners, number of current sexual partners, number of sexual contacts per month, diagnosed mental and/or gynecological disorders and, for women, the number of archived orgasms during a sexual contact.
A validated questionnaire from Stulhofer, et al. [10] was used with some adaptations that allowed the questionnaire to be completed by both sexes. Linguistic validation of the questionnaire was done by translating it from English to Slovenian and vice versa. The Cronbach’s alpha coefficient showed adequate internal consistency (α=0.963) for all statements. Based on the theoretical content relationship, we grouped certain statements into new cushions/variables:
My mood before sexual intercourse/activity (α=0.936):
• My sexual arousal toward a partner.
• Rate your sexual desire toward a partner
• My sexual response to a partner
• The intensity of my sexual arousal
My mood during intercourse/sexual activity (α=0.854):
• My emotional engagement during sexual activity.
• During sexual activity, I give myself to sexual pleasure
• The intensity of my orgasms
My partner’s mood during intercourse/sexual activity (α=0.936):
• Rate your partner’s sexual activity
• My partner gives in to sexual pleasure
• The way my partner is responsive to my sexual needs
• My partner is sexually creative
• My partner is sexually available
My balance in sexual intercourse/activities (α=0.857):
• Rate the appreciation of the pleasure I give to my partner.
• The variety of my sexual activities
• The frequency of my sexual activities
• The balance between what I give and what I get during sexual activity
• And the autonomic variable:
• My mood after sexual activity.
The modified questionnaire consisted of demographic data and 17 statements. A 5-point Likert scale was used for each statement, ranging from “not at all satisfied” to “extremely satisfied.” Data were analyzed using SPSS 26.0 statistical software. The Kolmogorov-Smirnov test and the Shapiro-Wilk test were applied to determine whether the values had a Gaussian distribution and to choose between parametric and nonparametric statistical tests. The Kolmogorov-Smirnov test and the Shapiro-Wilk test showed a non-normal distribution. Based on this result, a non-parametric statistical analysis was chosen, namely Pearson’s correlation coefficient and χ2 -test. The statistical significance was set at p ≥ 0.05.

Results

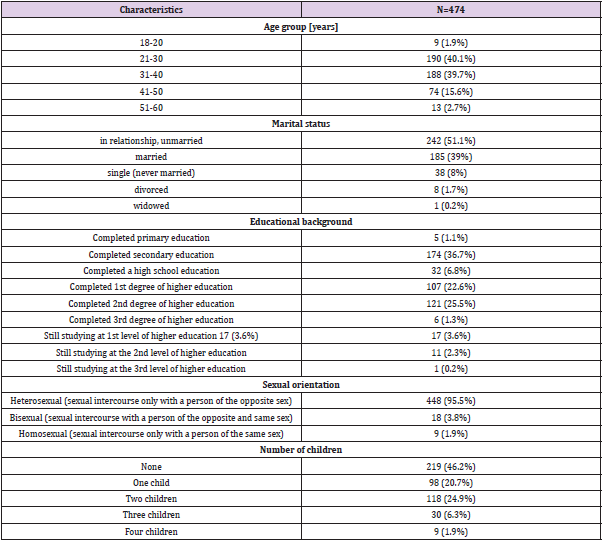
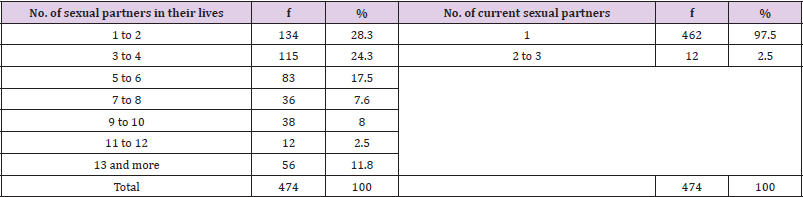
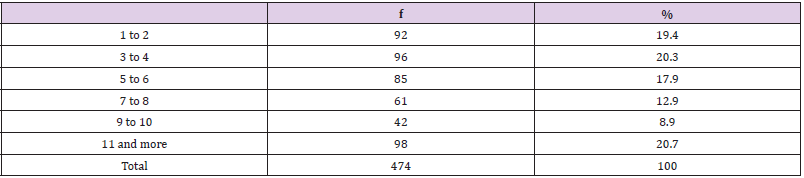
A total of 1418 questionnaires were received, of which 474 were fully completed. The realization of the sample was 33.43%. The sample included 405 female (85.4%) and 69 (14.6%) male participants. The basic demographic data are presented in Table 1. Participants were asked about the total number of sexual partners in their lifetime (Table 2). Most had one to two (n=134; 28.3%). Regarding the number of current sexual partners, respondents had one (n=462; 97.5%) or two to three (n=12; 2.5%) sexual partners (Table 2). In addition, the majority of participants had 11 or more (n=98; 20.7%) sexual contacts per month (Table 3). The female representatives were additionally asked about the number of orgasms during sexual intercourse. Most achieved two (n=178; 37.6%), three (n=110; 23.2%), one (n=69; 14.6%), and four or more (n=50; 10.5%) orgasms. Thirty-one (6.5%) participants did not have an orgasm, and 36 (7.6%) responses were missing. Twentysix (5.5%) participants were diagnosed with a mental disorder and 14 (3%) with a gynecological disorder. These individuals were also included in the study as we were interested in finding possible correlations.

biomedres-openaccess-journal-bjstr

Table 1: Demographic data of the participants.

biomedres-openaccess-journal-bjstr

Table 2: Number of sexual partners in their lives and current sexual partners.

biomedres-openaccess-journal-bjstr

Table 3: Number of sexual intercourses per month.

biomedres-openaccess-journal-bjstr

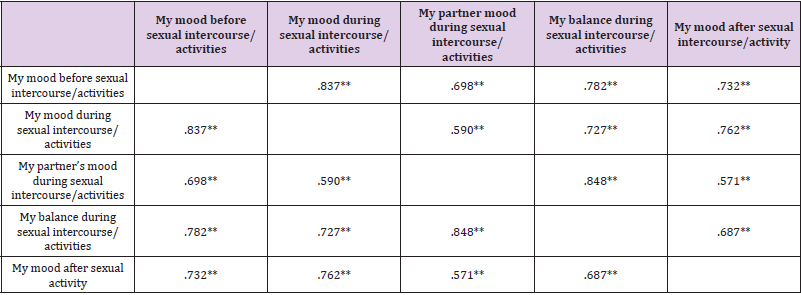
Table 4: Person correlations between the statements.

Note: **. p≤0.01

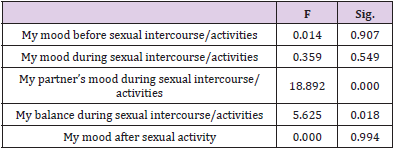
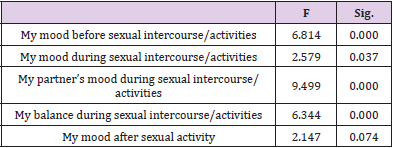
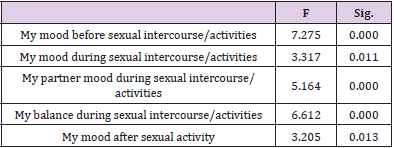
Based on Pearson correlation coefficient, strong correlations were found between mood before intercourse/activities and mood during intercourse (r=0.837), balance during intercourse/activities (r=0.782), mood after intercourse/activities (r=0.732) and partner’s mood rating during intercourse/activities (r=0.698). There were also correlations between mood during intercourse/activities and mood afterwards (r=0.762), balance during intercourse/activities (r=0.727), and rating of partner’s mood during intercourse/ activities (r=0.590). And between rating partner’s mood during intercourse/activities and balance during intercourse/activities (r=0.848) and mood after intercourse/activities (r=0.571) (Table 4). Female representatives were associated with partner mood and balance within sexual activity (Table 5). Male representatives showed no correlations with any of the cushions. In addition, correlations were found between an age group of 21 to 30 years and mood before, mood during, partner’s mood during, and balance during sexual intercourse/activities (Table 6).

biomedres-openaccess-journal-bjstr

Table 5: Correlation between gender and pillows.

biomedres-openaccess-journal-bjstr

Table 6: Correlation between the age group of 21-30 years and pillows.

biomedres-openaccess-journal-bjstr

Table 7: Correlation between number of children.

biomedres-openaccess-journal-bjstr

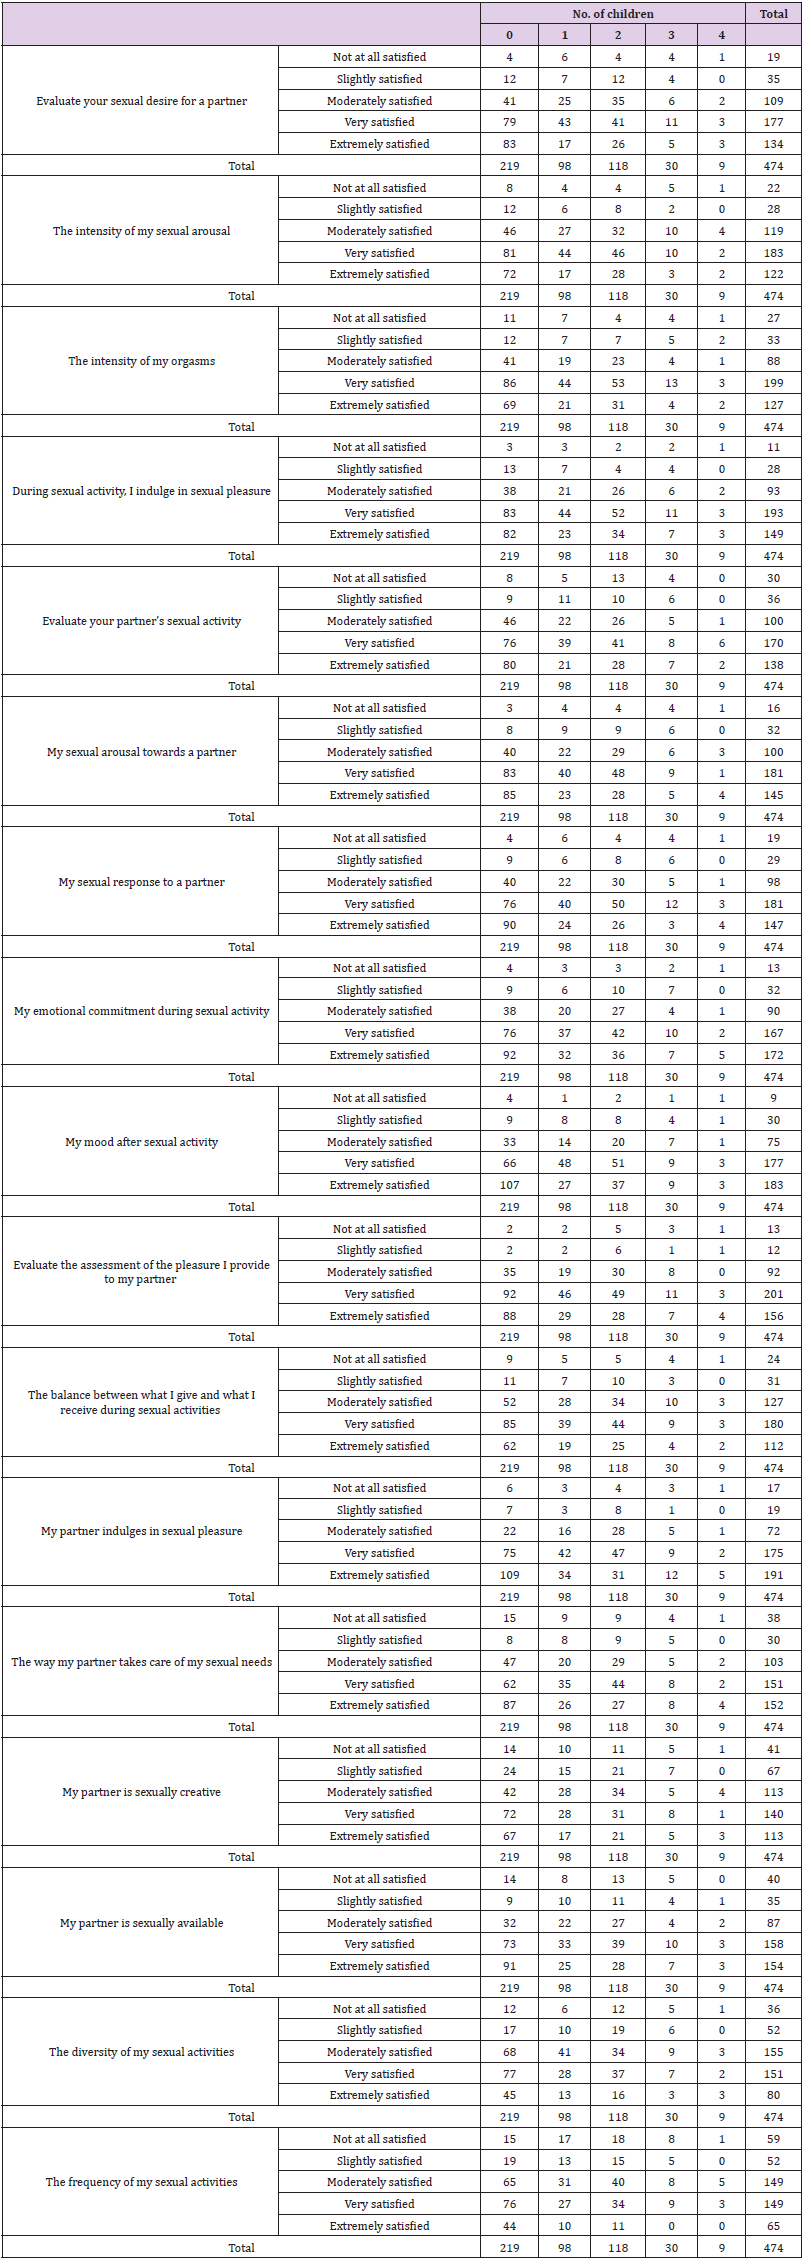
Table 8: Frequency distribution between the number of children and satisfaction-dissatisfaction.

Discussion

Although there are quality of life questionnaires that include questions about sexual satisfaction in the context of chronic disease, there is not much evidence of questionnaires that fully capture sexual satisfaction in the general population. Previous analyses included more women and examined the influence of menopause, body image, psychological distress from chronic disease, discomfort with sexual intercourse, and satisfaction with sexual intercourse. However, as far as we know, there is no questionnaire that includes different variables that could also influence men’s sexual satisfaction. Therefore, the aim of this study was to modify the already established questionnaire to more accurately capture the variables that have an impact on sexual satisfaction, in this case in a general Slovenian population. In our analyses, we included the general population of men and women and even individuals with mental and/or gynecological disorders. The questionnaire was adopted from Stulhofer et al. (2009) and modified to fully capture the sexual satisfaction of men and women from our population.
Based on the achieved reliability of the questions and results, we believe it can be used as a simple tool for clinicians in daily practise to facilitate communication about sexual satisfaction. Examination of correlations between general parameters such as gender, marital status, number of children, sexual intercourse per month, orgasms per activity and dependent variables for sexual satisfaction such as mood before, during and after intercourse and balance within intercourse showed interesting results. Satisfaction correlated well with mood before, during, and after sexual activity and, more importantly, with balance within intercourse. Important here are the questions that measure balance within sexual activity: ‘rating how much pleasure I give my partner’; ‘variety of my sexual activities’; ‘frequency of my sexual activities’; and ‘balance between what I give and what I receive during sexual activities’. This clearly shows that sexual satisfaction depends on the correlation with the activities of the participants and their partners during sexual intercourse. This was even confirmed by the correlations between female representatives and their partner’s mood (F=18.892; p 0.001) and balance during intercourse itself (F=5.625; p=0.994).
In several studies by Basson (2000, 2005, 2015) [11-13], the authors showed that women’s sexual desire is highly dependent on current relationship and partner dynamics, proving that women’s motivation for sexual intercourse does not necessarily arise from sexual desire, but is likely determined by the relationship [14- 17]. In addition, the results of our study proved that previous experience with more sexual partners, higher number of monthly sexual intercourse and orgasms, and younger age were associated with better sexual satisfaction. In addition, participants with more children showed lower sexual satisfaction. Having more children could affect sexual activity and thus sexual satisfaction. Intimacy is an important factor for women with children. The presence of children lowers the level of intimacy as women begin to ignore their sexual arousal because they focus primarily on the children and the family relationship [18,19].
Both were evident in our study, as participants without children were the most satisfied with their sex lives, followed by participants with only one or two children. Satisfaction decreased with the number of children, such that participants with three or four children were the least satisfied with their sex lives. In addition, there were statistically significant correlations between participants who had no children and mood before, during, and after sexual intercourse, partner mood during and after sexual intercourse (both p=0.001), and mood after sexual activity (p=0.013). In addition, Dewitte, et al. [20] showed that the situation of not having children increases sexual activity in women and even decreases the negative effect of sexual desire on sexual activity. Sexual satisfaction was also associated with the age of the participants. Age from 21 to 30 correlated with mood before and during intercourse, mood of partner during intercourse, and balance during intercourse. Increasing age is associated with lower quality of life [21] and therefore could also affect sexual aspects of life, such as number of intercourses per month, number of orgasms, and overall satisfaction.
However, there is a contradictory variable that could affect sexual satisfaction. Namely, in our study, the number of sexual partners also showed a correlation with satisfaction. In this case, we would expect older participants to have better sexual satisfaction than younger ones, but this was not the case. One reason for this is the specificity of the questionnaire we used in our study. The questionnaire specifically addressed sexuality and sexual activity rather than overall quality of life. A middle-aged person may have a higher quality of life than a person aged 21 to 30 because their life priorities lie elsewhere. Here we have not come across the financial influences, career, family and social status. These are all factors that significantly affect the quality of life. On the other hand, life experience in sexuality, as people learn more about their sexual preferences or those of their partner over the course of their lives, could also be an interesting influencing factor on sexual satisfaction. This is suggested by the study of Forbes, et al. [21], who found opposite results when examining sexual quality of life with age.
They observed a positive relationship between age and sexual quality of life. Accordingly, for older participants, the quality - rather than quantity - of sexual encounters was a more important predictor of higher sexual satisfaction. In our study, we did not specifically measure quality per se, but attempted to estimate quality based on pleasure, number of sexual encounters, and orgasms. This could be the reason why younger participants experience better sexual satisfaction than participants in older age groups. The number of sexual encounters became less influential with age [22]. However, in both reports, age was associated with a decrease in sexual aspects of life. Our modified questionnaire was informative enough, showed good reliabilities of variables of significantly above 0.8, and can potentially be used in daily clinical practice.
However, there were limitations in this study. Despite the large sample size, the questionnaire should be validated in further studies to obtain additional information about the reliability of the questions. Also, more comparisons should be made between different parameters such as gender, marital status, and sexual orientation to gain truly meaningful insights into the variables that influence sexual satisfaction. In addition, a larger sample of men should be included in the future, as the results cannot be generalized to the general population due to the predominantly female participants. As this study was designed as a pilot study, we intend to conduct further analysis and gather further insights as we consider the questionnaire to be meaningful enough.

Conclusion

The present study provided the results that previous experience with more sexual partners, higher number of monthly intercourse and orgasms, and younger age were associated with better sexual satisfaction. In addition, participants with more children showed lower sexual satisfaction. In addition, a newly modified questionnaire was used for the first time to assess sexual satisfaction in male and female representatives. The questionnaire was evaluated and can be used in clinical practice to assess the level of satisfaction with sexual life. By measuring sexual satisfaction using mood pillow ratings, the questionnaire is a suitable tool for further evaluation and for a larger sample to obtain additional data on factors that might influence sexual satisfaction.


For more Articles on: https://biomedres01.blogspot.com/

Wednesday, February 1, 2023

Review of Temperature Measurement Techniques


Review of Temperature Measurement Techniques

Introduction

Phase change phenomenon involves instantaneous variations of the local heat transfer, which is coupled to the unsteady fluid currents overlying the surface. An example is the sessile drop, which is of interest in several fields including coating, combustion, and cooling facilities. Understanding of these mechanisms requires fine spatial and temporal measurements, which is essential for applications associated with design optimization and safety consideration of a process. Such consideration is crucial within the operations of boilers, for instance, where the evolved heat flux is restricted by the boiling crisis. This operational regime is often associated with equipment failure. Within the miniaturized electronics applications such as transistors, high heat fluxes up to 200 W/cm2 can be liberated from such instruments, where a low wall superheat is desired with respect to the cooling fluid. Thus, operating within the correct boiling regime becomes paramount in the thermal management of the operating equipment [1-4]. In addition, some of the proposed models are not well validated due to the limited resolution of the available data, which might bring about a misinterpretation of the phase change phenomenon under study. Such situations can be encountered with respect to models based on point measurements, which cannot resolve fine spatial resolutions associated with phase change phenomenon [5-6]. In the current paper, some of the relevant temperature measurement techniques are provided, which include point measurement techniques and IR thermography. A review of fluorescing materials and their usage within temperature measurement applications are given by the end of the paper.

Point Measurements

A conventional point measurement technique is the thermocouple, which operates on the basis of Seebeck effect. In principle, two dissimilar metals are connected at a junction, which generates a small voltage with respect to a given temperature. Such technique was used to acquire average heat flux measurement over a surface of interest [6]. In parallel to this technique, Truong [7] considered using a heat fluxmeter, so as to evaluate the heat transfer coefficient associated with a heat sink, via Newton’s law of cooling. The drawback of such methods is that its usage is limited to quasi-steady state regime, which cannot be used for complex flow phenomena, due to multidimensionality and the instantaneous local changes of the fluid-wall interaction [6-7]. In case of the heat fluxmeter, significant measurement error can incur, in case the thermal properties of the instrument was not well quantified [7].

Resistive Based Sensors

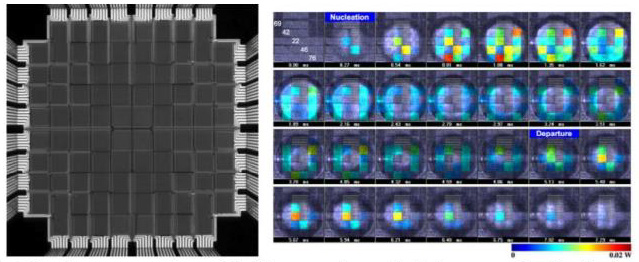
In the past decades, thermal resistance-based sensors has been the focus of wide of variety of applications. These include thermal actuator, flow rate and temperature measuring devices, and sensors pertaining to gas monitoring within food logistics [8-10]. Several studies focused on developing high compact microheater sensors, with competitive spatial resolution performance. Such advances were permitted with development of microfabrication, which enable one to realize fine features as small as a submicron length. Such sensors can play a crucial role in detailed examination of adverse flow condition, as in phase change application for instance, which can be achieved by its instantaneous measurement at multipoint resolution and its conformity to nonplanar surfaces [11-14]. Among the various works on resistive sensors, is the one done by Guereca [15] in the field of microelectromechanical systems, which was used in boiling application. The instrument used in Guereca [15] study was fabricated via ion beam milling and photolithography, which had a dual function of providing heat to surrounding fluid and for temperature measurement purposes. The latter used to measure the nucleation temperature, based on sudden changes in the observed temperature, with respect to the temperature coefficient of the instrument resistance [15]. Figure 1 depicts the microheater array used by Demiray and Kim [16] within FC-72 pool boiling experiment.

biomedres-openaccess-journal-bjstr

Figure 1: Micro heater array for pool boiling experiment (left), heat transfer distribution under nucleating bubble at micro heater surface (right) [16].

Some of the major challenges with respect to the sensor’s fabrication regard the dimensional scale difference between the patterned lead connection and the deposited sensor metal, which is one of the main causes for electrical disconnection, due to the sensor’s breakage along the lead’s edges. Such issues are further complicated if an adhesion layer exist between the flexible substrate and the pattern leads. In addition, it is crucial to include a thermal insulation within the metal sensor design, which can affect its performance criteria, such as measurement sensitivity and resolution [11-12,17-19]. Also, some studies have indicated deviation of the material properties from bulk metal value for thicknesses close to the mean free path. For instance, Siegel, et al. [20] observed an inverse relation between resistance and temperature for gold thickness of several nm, as opposed to the proportional correlation between resistance and temperature for bulkier gold thicknesses. Inhomogeneity in the deposited sensor can lead to large temperature gradient on the sensor’s surface, which can affect the integrity of the temperature measurement. For instance, Guereca [15] noticed that the acquired temperature measurement was lower for thinner fabricated resistive sensor. Lastly and not least, such temperature measurement requires direct contact with fluid of interest, and it has an element of Joule’s heating. Thus, there is some form of intrusion upon the investigated phenomenon, which might induce some form of error.

Non-Contact Local Temperature Measurement Techniques

A breakthrough in surface temperature measurement has been achieved recently, via infrared (IR) technology, which permitted local heat flux measurements at fine spatial resolution. Such technique proved to be of an essence in proper understanding of heat transfer mechanism, and to further elaborate existing models and correlations.

Infrared Thermography

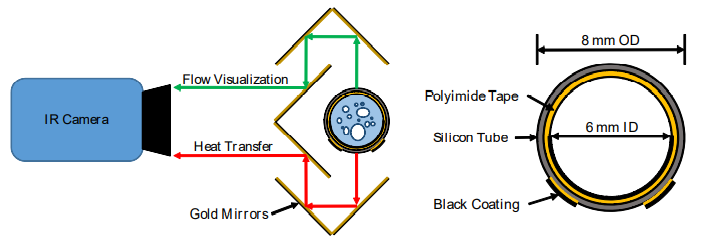
Several studies utilized Infrared (IR) technique in order to resolve the local wall heat transfer in both pool and flow boiling applications. An example is the study conducted by Scammell and Kim [21], where they examined the effect of vortex shedding upon the local wall heat transfer in flow boiling applications. A schematic of the flow boiling test section is shown in Figure 2. The IR measurements in such studies are based on black coating of the wall surface, adjacent to the working fluid, which acted as temperature markers for the IR camera. The temperature profile across the wall was deduced numerically, in a coupled radiationconduction problem from which the local heat flux profile was resolved [21].

biomedres-openaccess-journal-bjstr

Figure 2: Flow boiling test section setup featuring golden mirrors for simultaneous heat transfer measurements and flow visualization (left image), and cross-sectional view of the flow boiling test section (right image) [21].

Some of the major obstacles associated with IR thermography, pertains to the availability of the IR optical properties, which is required to resolve the temperatures across IR transparent materials, such as silicon and Kapton tape [6,22-24]. Not to mention that IR transparent materials are not easy to machine, such as in the case of CaF2 [25]. In addition, in case there is a sharp temperature gradient, there is a restriction on the minimal number of pixels covering an area, so as to resolve the spatial temperature distribution at a region of interest [22-23]. Jason [23] has also raised an issue pertaining to the integration time with respect to the calibration range, where an error in the order of 10 degrees can incur, in case the measurement was done outside the calibration range.

Time Domain Thermoreflectance

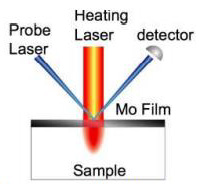
Another non-contact measurement technique is the time domain thermoreflectance (TDTR), which relies on the examining the material reflectance property variation with temperature. A schematic of the TDTR technique is shown in Figure 3. Such approach is applied in order to determine the thermal properties of materials, which is of interest within the development of new materials, including nanomaterials and thin films. In a study by Mehrvand and Putnam [24], the heat transfer coefficient at the thermal boundary layer within a flowing fluid was examined using TDTR technique. One of the advantages of the TDTR techniques is its spatial resolution relative to IR thermography, due to its use of visible light. On the other hand, TDTR requires a complex setup, which involves various optical equipment and probing instrumentations. Therefore, its generally not applicable to the complex geometries that can arise in boiling heat transfer application.

biomedres-openaccess-journal-bjstr

Figure 3: TDTR setup for material thermo conductivity measurement (ww.nist.gov/programs-projects/measurements- and-standards-thermoelectric-materilas).

Fluorescing Measurement Techniques

The following subsections summarizes the measurement techniques that utilizes photoluminescent materials, such as liquid crystals and quantum dot. Such measurement approach relies on the spectral emission variation of such materials temperature, which can give a fine spatial resolution of the surface measurement.

Liquid Crystals

Thermographic techniques based on liquid crystals and fluorophores has been suggested as a temperature indicator. One such an attempt is the work done by Kenning [26], where he examined the wall temperature profile within nucleate boiling application, via a thermochromic liquid crystal. However, such techniques can involve tedious calibration procedures and limitations associated with equipment availability and operating costs [27-30]. Not to mention, the narrow temperature operating range by liquid crystal technique [25].

Quantum Dots

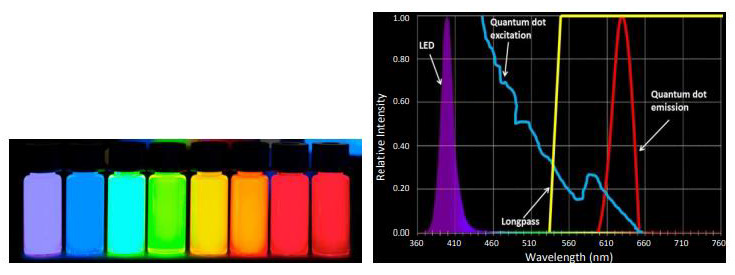
Quantum dots (QDs) are semiconductors whose length scale is in the order of nanometers and thus subject to 3D confinement. QDs have unique optical properties relative to traditional fluorophores in which it can be excited by a wide range of wavelengths. In addition, it emits light over a narrow spectrum at a longer wavelength, which can easily be captured using a long pass filter. Solid-state lamps in the form of LEDs are usually used for QD excitation purposes. As a direct consequence of the QD length scale, the color of the emitted light can be tuned by changing the QD size via temperature and synthesis time control of the fabrication process. Examples of QDs spectrum emission variation is shown in Figure 4. QDs are prepared in a colloidal liquid, and it can easily be transferred to surfaces of interest via spray or spin coating. Such versatile fabrication processes can greatly downsize the expenses, pertaining to facility complexity [31-38]. Other QDs delivery methods include electrostatic coating, UV curable solutions, as well as sol-gel approach [38-42]. According to the airy diffraction theory, the minimum spatial resolution that can be detected by a camera (x) is related to the observed wavelength (λ) by Equation 1. In Equation 1, f is the distance between the lens and object and d is diameter of the aperture. Thus, QD has a spatial resolution advantage over IR thermography, where local heat flux measurements can be acquired at submicron ranges, due to its smaller wavelength emission [43].

xf =1.22λd (1)

biomedres-openaccess-journal-bjstr

Figure 4: QD, (left) emission from dots of increasing size from left to right (Wikipedia.org/wiki/quantum_dot).(right)Spectral characterization of QD.

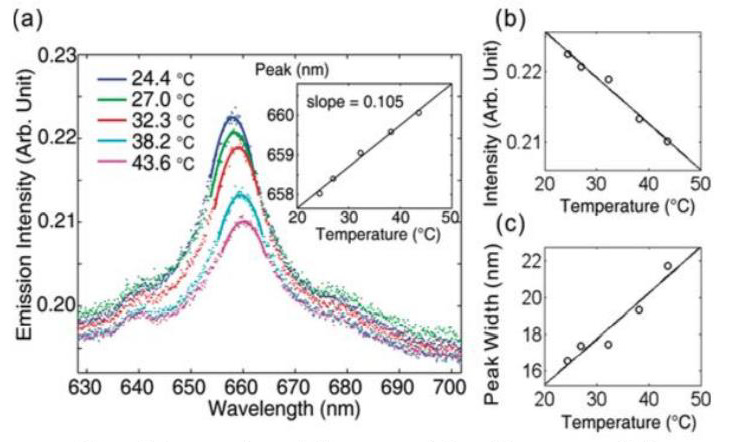
Another characteristic of QDs is the temperature dependency of their optical properties as shown in Figure 5, which can be exploited for temperature measurement purposes. This can be related to stoke shift behavior of QDs, which is related to the photoluminescence peak shift, as was observed in previous studies [33,37,44-46]. The temperature variation alters the QD optical properties due to thermal expansion of the QD structural lattice [30,36]. Two trends are evident. The intensity of the emitted light tends to decrease with temperature and the peak in the emitted spectrum tends to shift to longer wavelengths. The changes in the intensity and peak wavelength spectra are not necessarily proportional with temperature. The emitted light intensity changes with temperature tend to be quadratic, which makes it less precise than spectral measurement over large temperature ranges [37,45].

biomedres-openaccess-journal-bjstr

Figure 5: Quantum dot optical property variation with temperature [44].

Relative Intensity
1.00
0.80
0.60
0.40
0.20
0.00
360 410 460 510 560 610 660 710 760
Wavelength (nm)
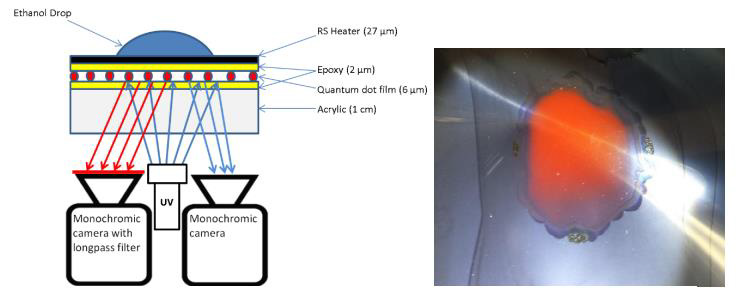
Several studies have used QDs to measure temperature. Al Hashimi and Kim [47] investigated the local heat flux distribution arising from the vaporization of an ethanol drop, where QDs dispersed within a gelatin film were used to acquire surface temperature variation underlying the ethanol drop. The experimental setup for the ethanol drops temperature measurement is given in Figure 6. Matsuda, et al. [31] used ZnSAgInS 2 QDs for surface temperature measurement due to their low toxicity and high temperature sensitivity. Jorge, et al. [33] achieved independency from the excitation source intensity by using multiple QDs with different emission spectra and looking at the intensity ratio. Sakaue, et al. [34] developed a QD temperature sensor for cryogenic application. Li, et al. [44] examined the temperature profile of a micro-heater by calibrating the spectral shift of QDs with temperature. They emphasized the importance of QDs particle concentration on a surface so as to achieve a certain temperature precision as a result of particle size variation [44].

biomedres-openaccess-journal-bjstr

Figure 6: Ethanol drop experimental, (left) test setup, (right)QD-gelatin film.

The average temperature precision was enhanced at a higher number of QD particles, according to Li et al. [44]. Wang et al. [39] developed a miniaturized temperature sensor in the form of a reflective fiber for high temperature applications. In a similar line of work to Wang et al. [39], Bueno et al. [37] developed a photonic planar waveguide temperature sensor using nanocomposites of CdTe and CdSe, which were embedded in PMMA. QDs-PMMA nanocomposites have a peak spectral emission at a shorter wavelength than colloidal solutions of QDs, due to the particles agglomeration and waveguide effects introduced by PMMA matrix. In addition, PMMA tends to be hydrophobic, which minimizes the effect of humidity upon temperature measurement [37]. One of the issues pertaining to QDs can be related to the photobleaching degradation of the emission, which is associated with the breakdown of QDs as a result of continuous light excitation. Other issues pertain to the temperature calibration, which is sensitive to the observed noise in the QD emission readings. Such issues can be remediated by utilizing a high quantum yield of QDs, or photoluminescence emission, and by utilizing CCD cameras instead of CMOS cameras for higher signal to noise ratio [33-34,48-49]. Yu, et al. [45] reported an initial blue shift of the QDs peak spectral emission to shorter wavelengths during the first heating and cooling cycles. Such behavior was resolved by exposing the QDs to several thermal cycles, which resulted in a reproducible spectral peak emission with respect to temperature. Other issues pertain to photooxidation, which can cause an irreversible blue shift due to interaction with surrounding gases [48]. Also, the concentration variation of QDs on a particular area can bring about an uneven intensity distribution, since it’s difficult to control the uniformity of QDs over a surface [38,44].

Temperature Sensitive Paint

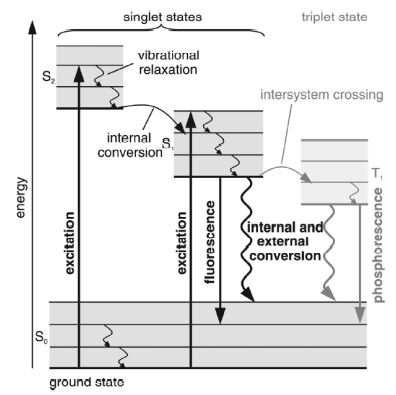
Another fluorescing material that works under the same principle as the quantum dots is the temperature sensitive paint (TSP), which comprises of a light emitting luminophores and a binder. As shown in Figure 7, the luminophores gets excited to a higher energy state upon absorption of photons from a short wavelength light source. Afterwards, the excited luminophores undergoes a decay to a lower energy state, where it emits light at a longer wavelength. This process is called photoluminescence. Two conversion processes compete with the photoluminescence of the TSP, which causes the luminophores to decay closer to its ground state: first, the external conversion of the luminophores energy, which is associated with its emitted light quenching via molecular interaction. Such process is relevant within pressure sensitive paint applications, where various oxygen concentrations are associated with different light emission intensity from the luminophores. The second type of the luminophores conversion processes is the internal conversion, which is associated with the energy state variation of luminophore with temperature. Such process is called thermal quenching [25]. The material selection for the luminophores and the binder governs the optical characteristics of the yielded TSP. For instance, the temperature dependency of the luminophore’s light emission varies from one material to another. In addition, the operation of the paint as a temperature sensitive or pressure sensitive paint depends on the binder permeability to oxygen [50]. Recent interest in TSP has emerged in several applications, as a local temperature measurement mean.

biomedres-openaccess-journal-bjstr

Figure 7: Jablonsky energy-level diagram [25].

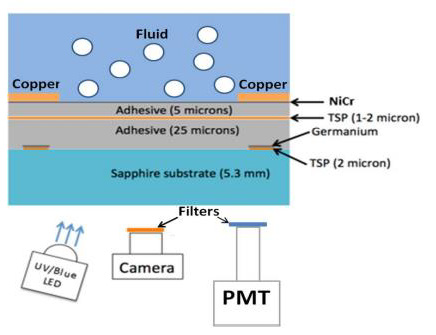
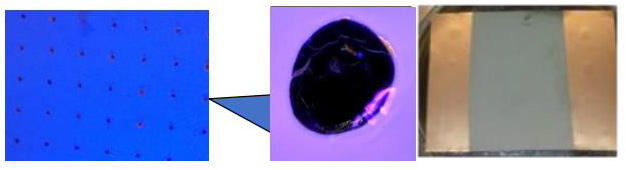
One of those attempts is the work by Al Hashimi, et al. [51], where Ruthenium based TSP was used to measure the local heat flux distribution within both pool boiling and flow boiling application. Figures 8 & 9 illustrate the test section set up within the pool boiling experiment, where the local heat flux distribution was acquired using the inverse heat conduction problem. The temperature measurement across the adhesive layer was used as boundary conductions for the heat conduction problem, where the heat evolved to the boiling fluid was evaluated as the difference between the heat generated at the NiCr heater and the heat lost to the Sapphire substrate. In Shibuya, et al. [52] study, local temperature variation was captured in form of TSP intensity changes, as a consequence of a passing bubble. Several studies utilized TSP optical properties for surface temperature measurement within wind tunnel facilities some of which were involved in hypersonic flow conditions.

biomedres-openaccess-journal-bjstr

Figure 8: Schematic of the test section.

biomedres-openaccess-journal-bjstr

Figure 9: Depiction of the germanium dot and NiCr heater.

Among the various wind tunnel experiments are the work by Kurits [53], Bhandari [54], Lee, et al. [50], Schramm, et al. [55], Huang [56], Yang, et al. [57] and Ozawa et al. [58], where the local temperature distributions were deduced from surface of interest, based on the observed TSP emission. In more recent study by Liu and Risius [59], TSP is used for thermal imaging purposes within high-enthalpy shock tunnel application. Within Liu and Risius study, a reliable heat flux sensor was used in conjunction with an in-situ calibration technique, so as to determine the thermal penetration within the TSP layer, via an analytical inverse solution [59]. Long [60] utilized multiple luminophores one of which is temperature insensitive, so as to account for the intensity variation within the excitation light source. In a study by Huang, et al. [61] examined the temperature profile within a microchannel flow application, via the optical properties of the TSP. Simultaneous flow visualization and thermal profiling was achieved by Matsuda, et al. [62] for a multiphase flow phenomenon, within microchannel applications. In Matsuda study, TSP was used to survey the temperature profile at various flow boiling conditions, where the acquired Nusselt number was in good agreement with the Sieder- Tate equation [62]. Other work by Ishii and Fumoto [63] utilized TSP in order to acquire temperature distribution at the evaporator wall of a pulsating heat pipe. From the temperature data analysis, a correlation was acquired between the temperature distribution and the observed oscillatory flow phenomenon within the pipe. In addition, a temperature accuracy of 0.263°C was reported within Ishii and Fumoto study [63].

Recent interest in luminophores utilization was found in other applications, such as its usage as PSP. Examples are the studies carried out by Jiao, et al. [64,66,67]. In Jiao, et al. [64] study, a twodimensional correction factor was adopted in the data analysis, so as to resolve the temperature sensitivity of the PSP. Such result was validated against CFD data. In another study by Noda, et al. [66], PSP was used to resolve the transient pressure field on a NACA 0012 airfoil. Other applications for PSP include jet impingement, such as the study carried out by Li, et al. [67], where it was used to examine the pressure field characteristics near the impingement point, such as the nozzle-plate distance, impingement angle, and pressure ratio. The luminophores suffer from similar shortcomings as the quantum dots. For instance, paint thickness inhomogeneities over the surface as well as non-uniform excitation light illumination are among several factors attributed to the observed noise within optical measurements. Background noise and particulates can also interfere with the optical properties of the TSP, which can bring about a shift in the observed intensities. Photobleaching effect tends to be more severe in the case of TSP [68]. In a recent study by Liu et al [69], the temperature dependency of the thermal diffusivity parameter was addressed within the TSP heat flux measurement, which can arise within hypersonic wind tunnel applications. A correction factor was developed within Liu et al study, which was validated against simulation data [69]. Other issues pertaining to the error arising from the TSP apparent temperature relative to the actual wall temperature, as was suggested in a study by Liu, et al. [70]. Such discrepancy becomes more prominent as the thickness of the TSP layer increases, relative to adjacent layers [70].

Conclusion

In the current review paper, various temperature measurement techniques were examined, along with their applications in various research works. Conventional temperature measurement techniques include thermocouple and microheater arrays, where thermocouples can misrepresent the local interaction at the measurement surface, due to its spatial limitation by its average measurement approach. On the other hand, microheaters are complex to fabricate and are difficult to install on non-flat geometries, such as tubes. In the past decade, IR thermography was adaptedas a measurement technique, which can monitor the temperature distribution at a micron resolution. Therefore, an enhanced measurement fidelity can be achieved with respect to the investigated phenomenon. Some of the drawbacks of the IR technique is its compatibility with the measurement surface, which can be opaque to the IR wavelength or are generally expensive to acquire. Novel temperature measurement approaches involve fluorescing materials, which act as a potential alternative to IR thermography. Such materials include QDs and TSP, which operate within the visible wavelength. Hence, a broader range of materials can be used as a substrate for the experiment, where an affordable monochromic camera can be used for local temperature measurement purposes in various applications, such as pool boiling.

For more Articles on: https://biomedres01.blogspot.com/

Faba Bean Varieties Response to Phosphorus Application on Yield and Yield Components at Kulumsa Area of Tiyo District, Arsi Zone, South-Eastern Ethiopia

  Faba Bean Varieties Response to Phosphorus Application on Yield and Yield Components at Kulumsa Area of Tiyo District, Arsi Zone, South-Ea...